Map & Navigation
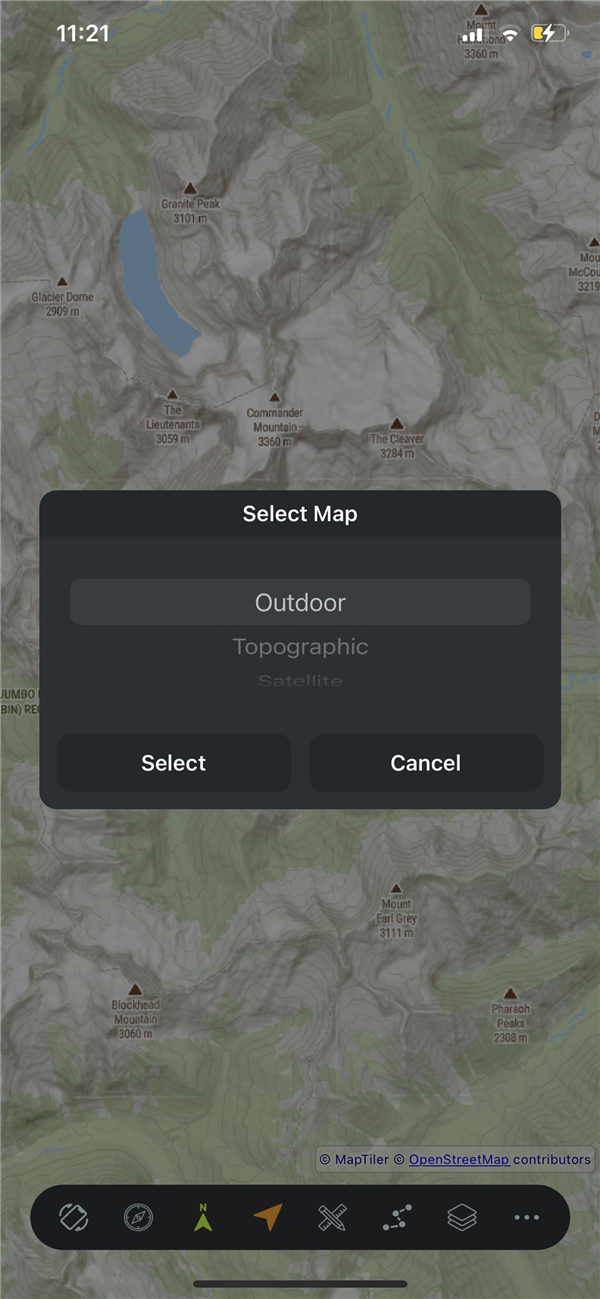
Map Selection
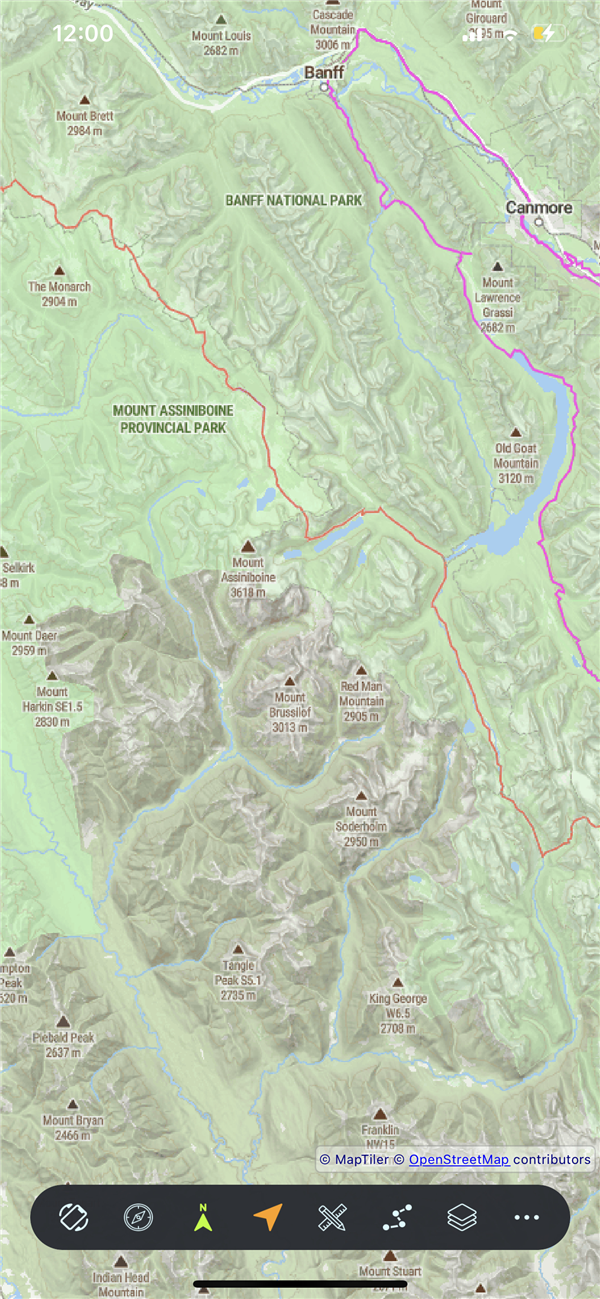
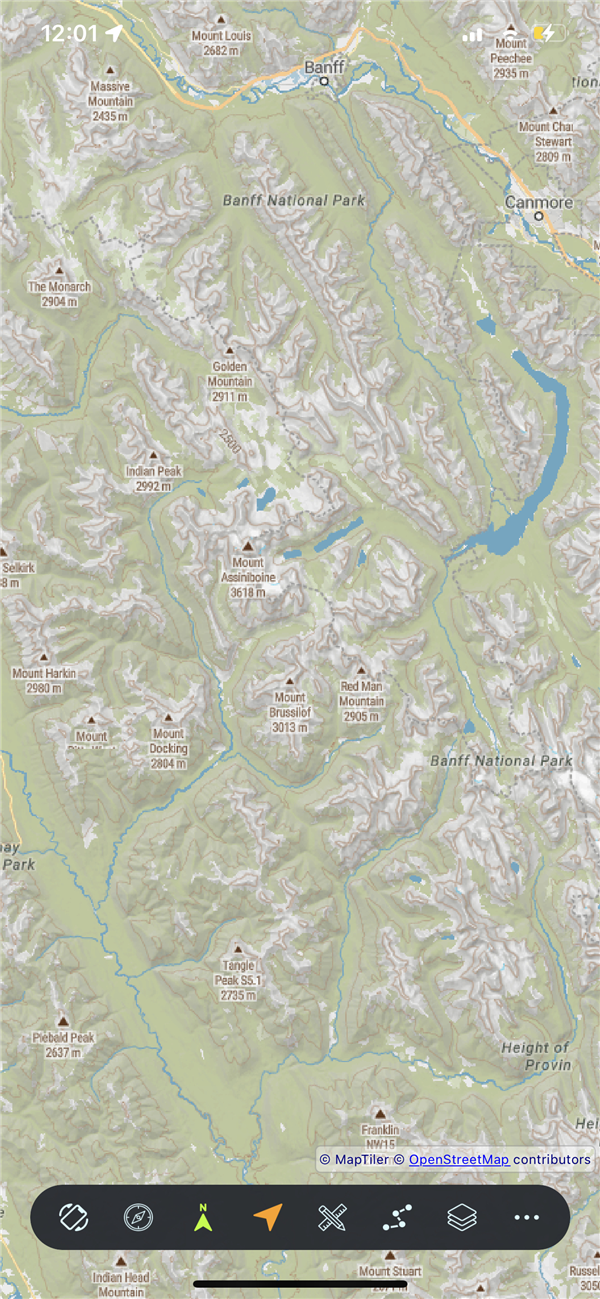
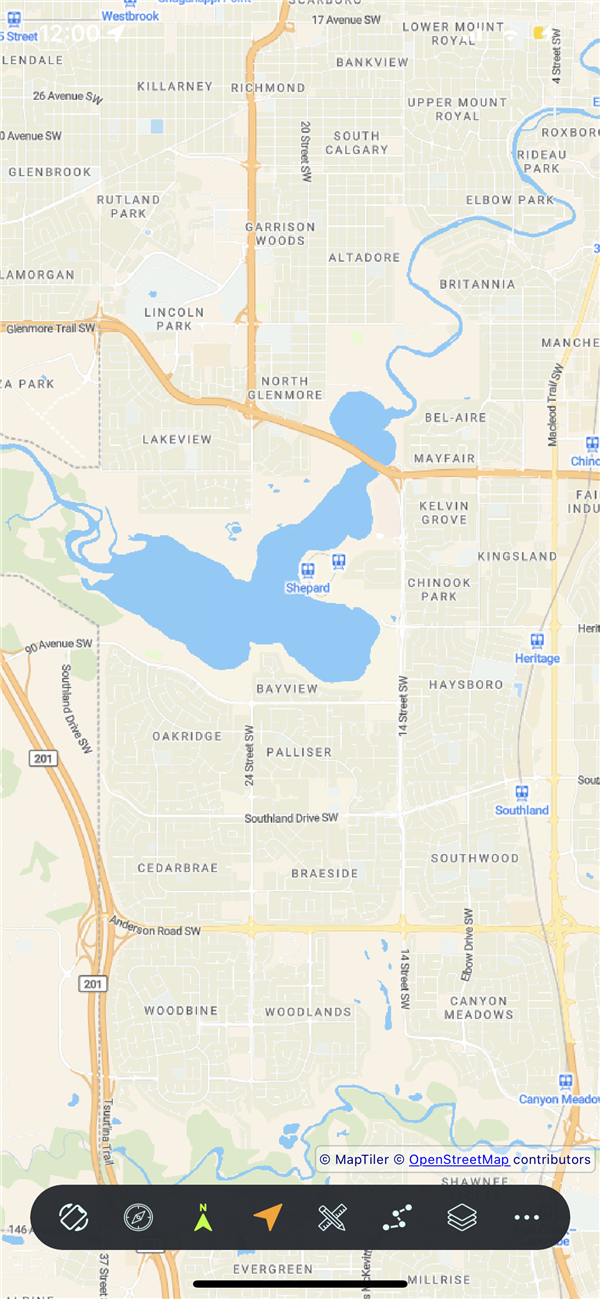
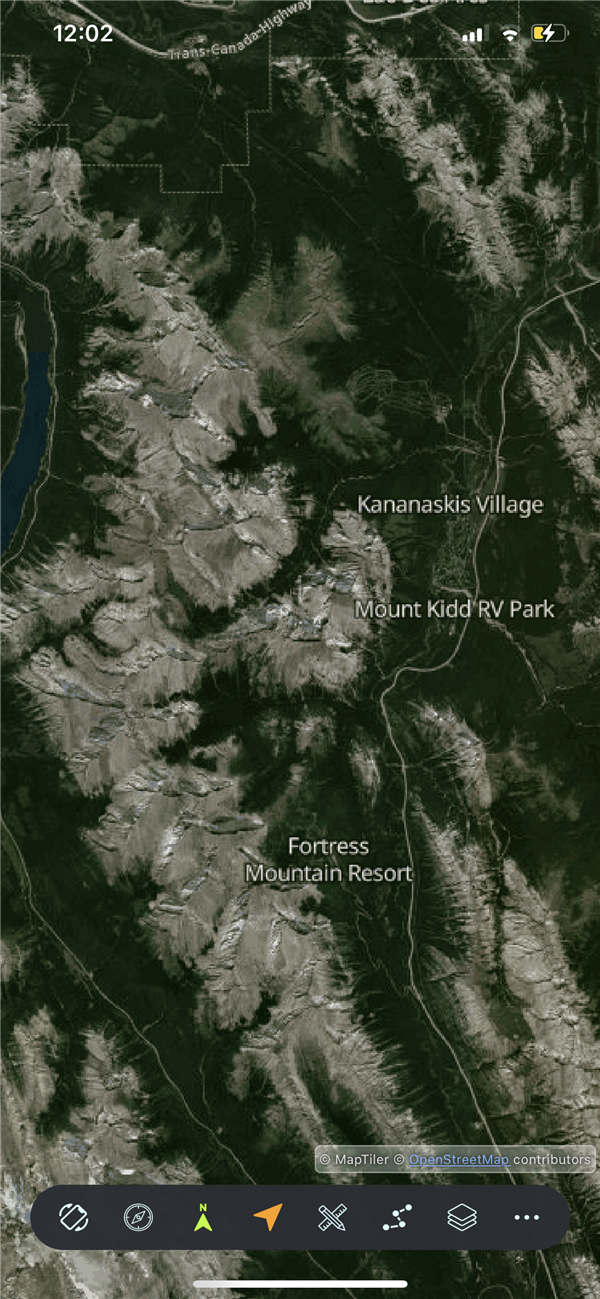
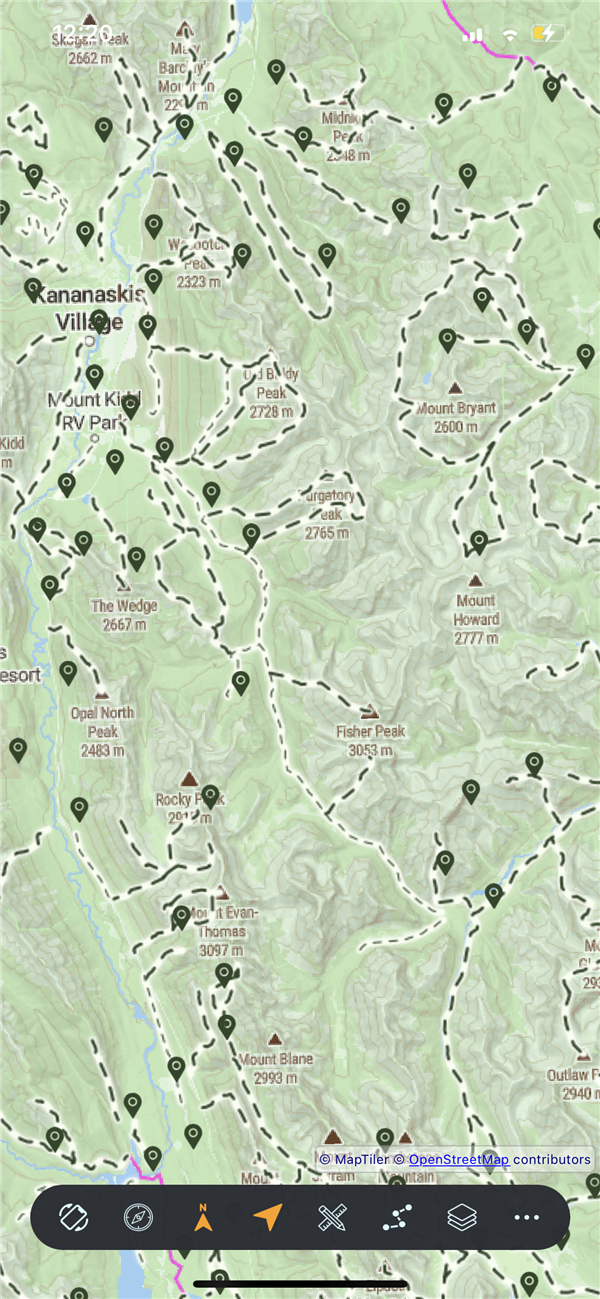
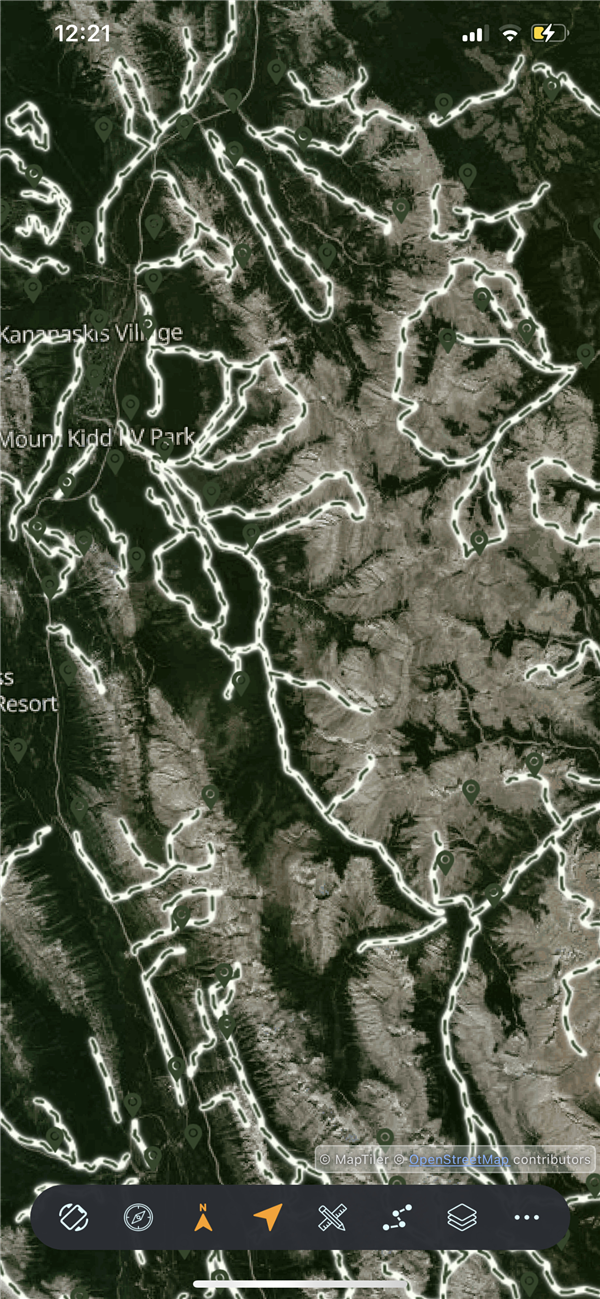
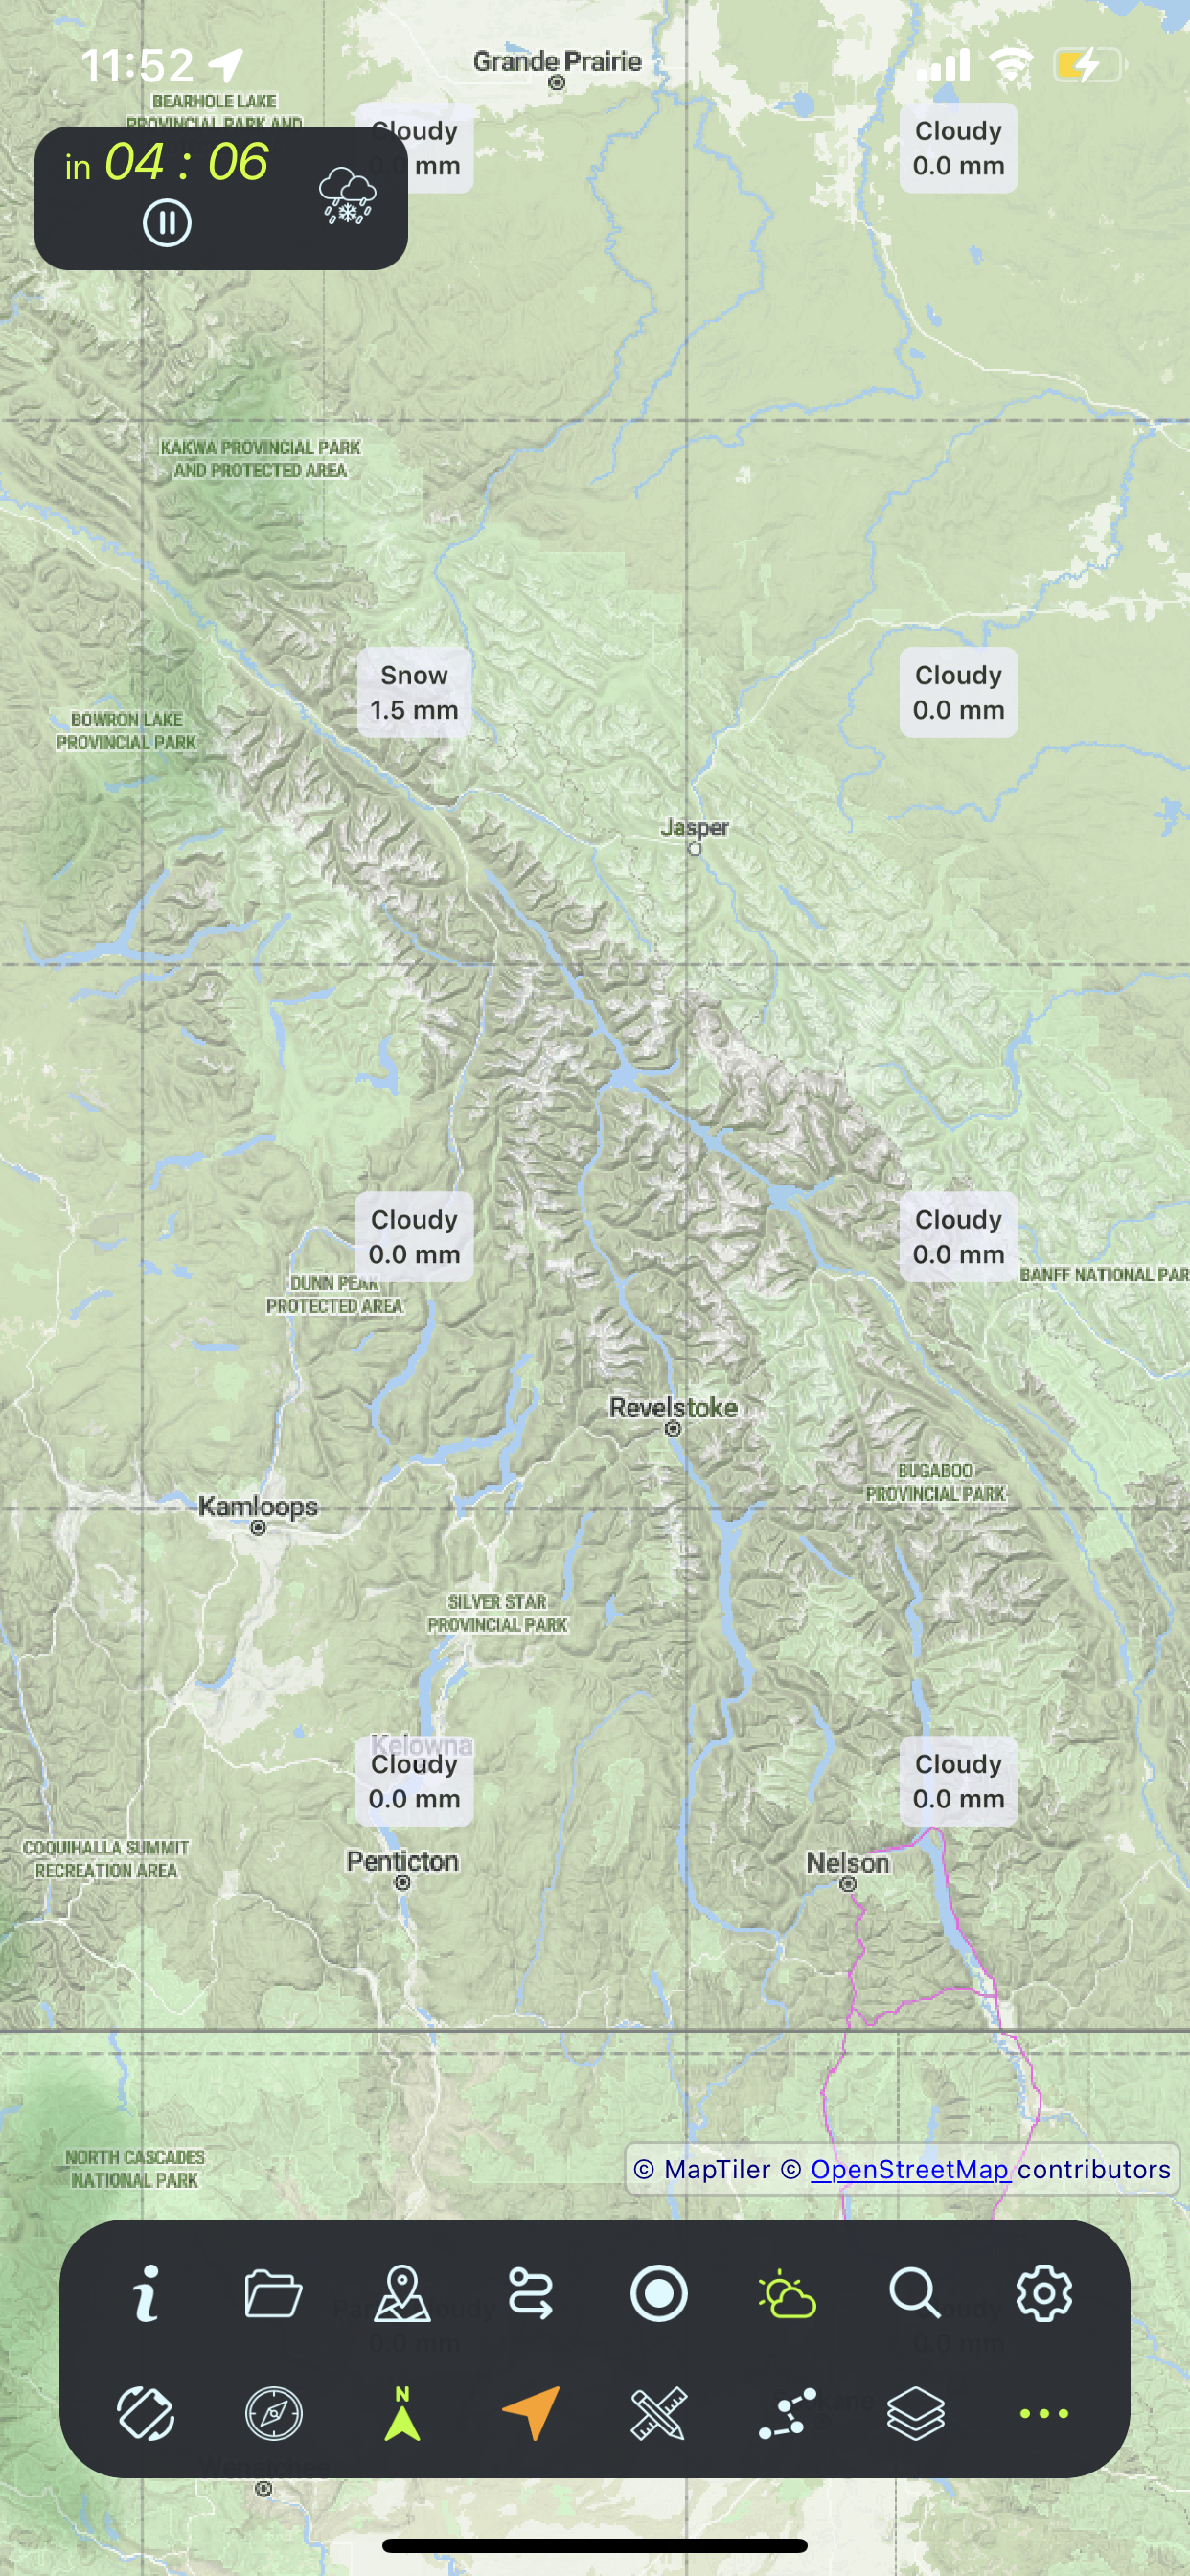
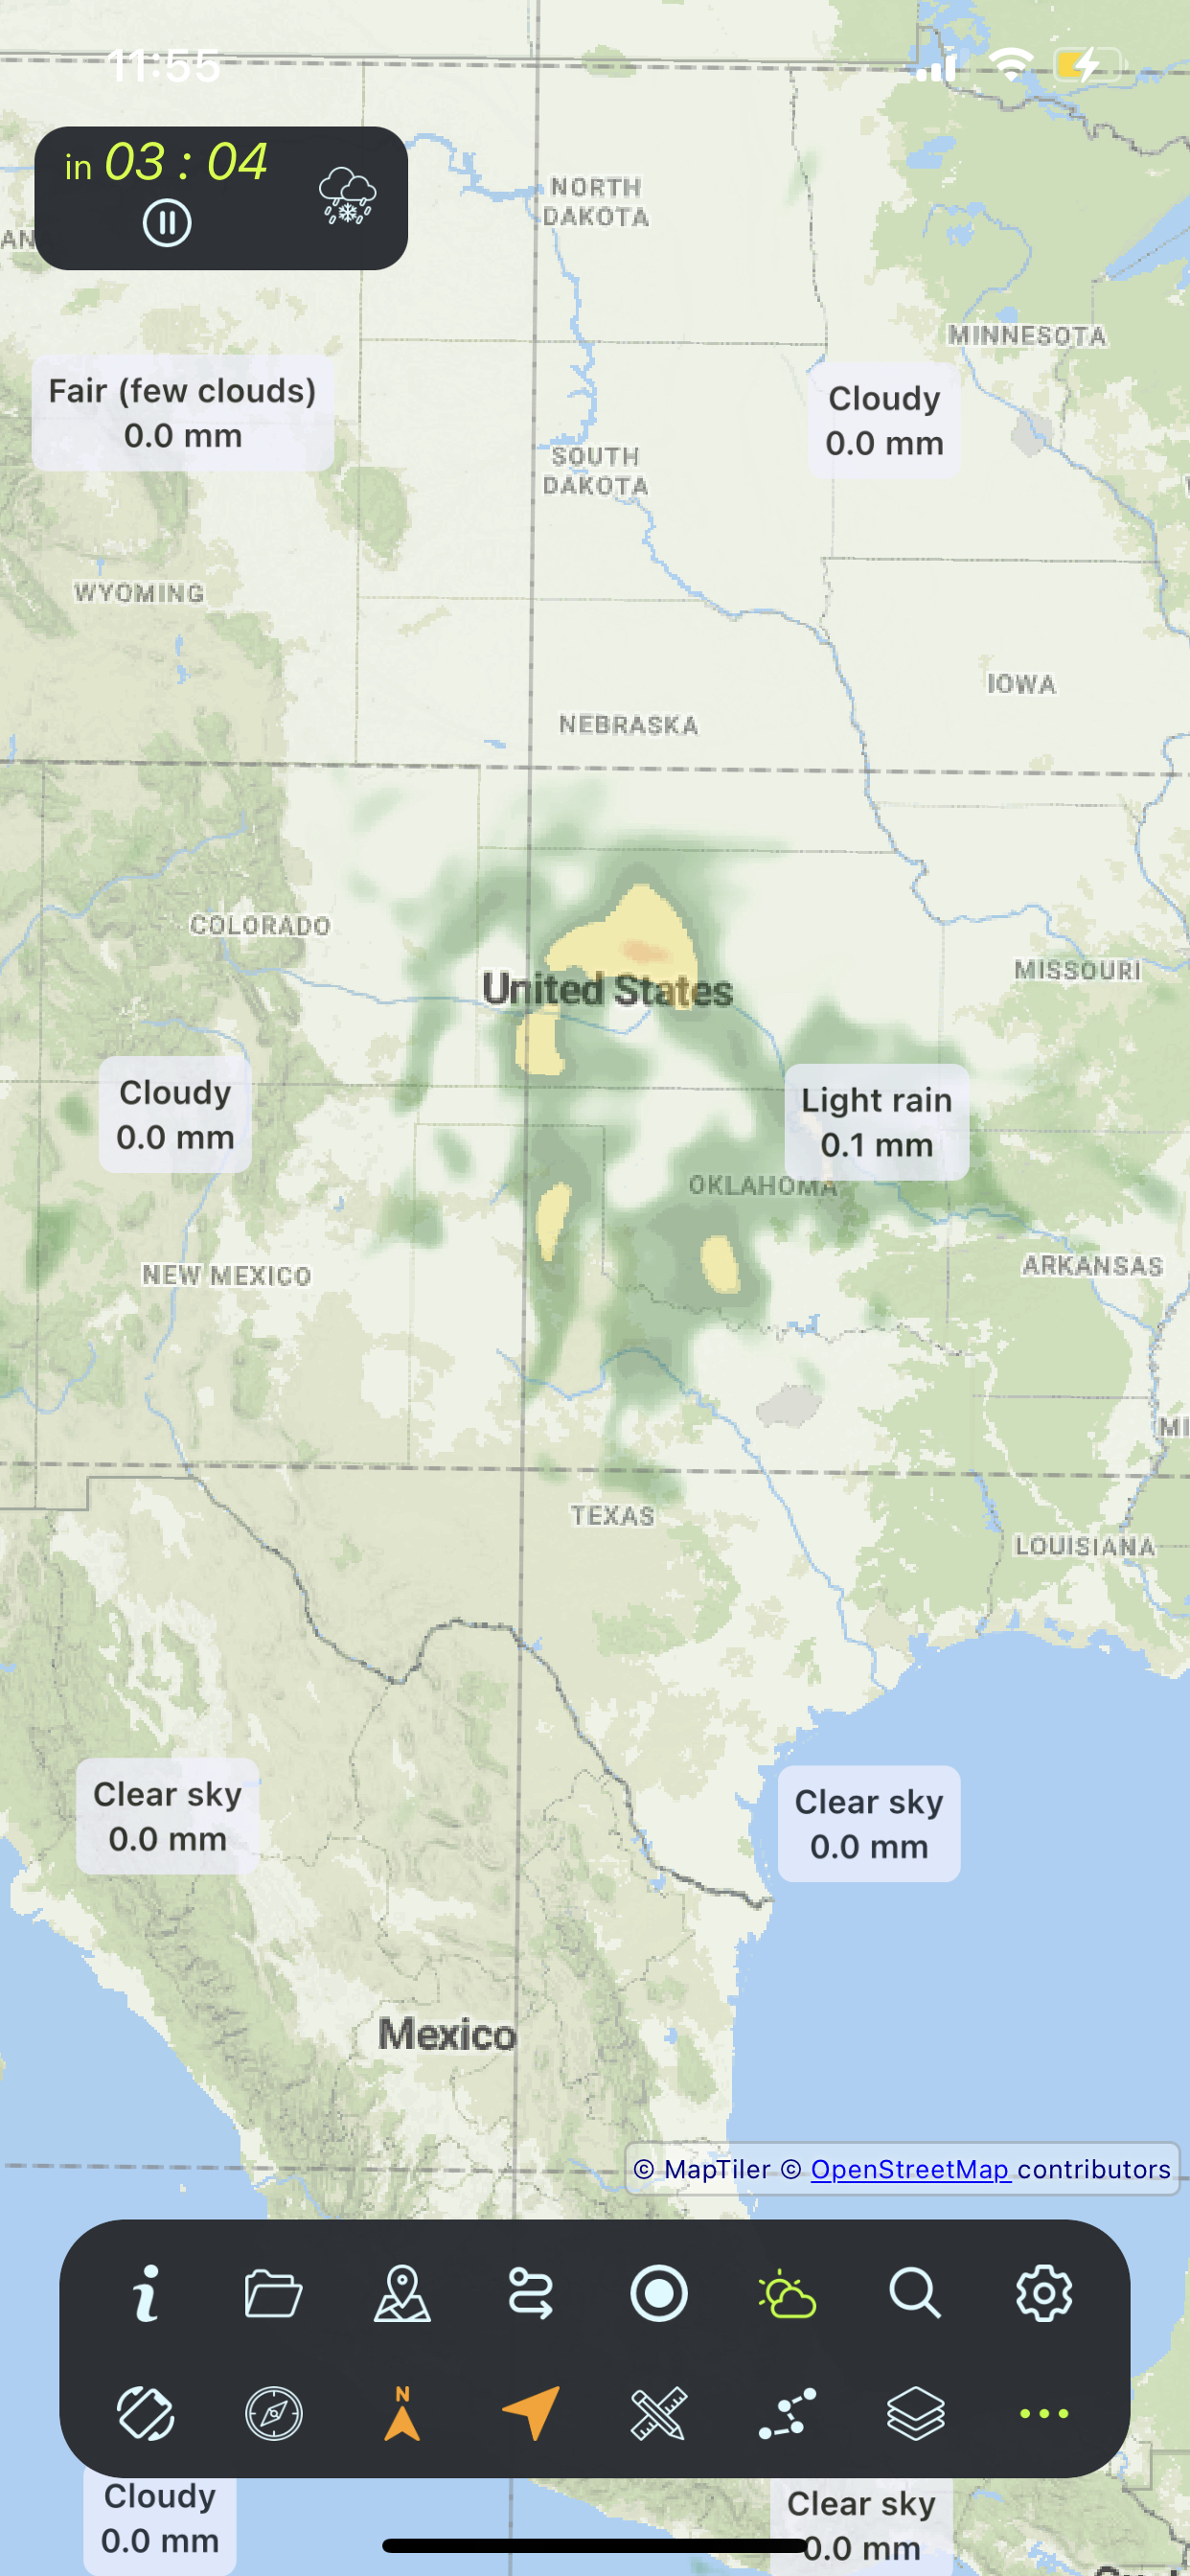
Outdoor, Topographic, City and Satellite maps
Map Gestures
Pan, zoom, rotate, tap, and long-press controls
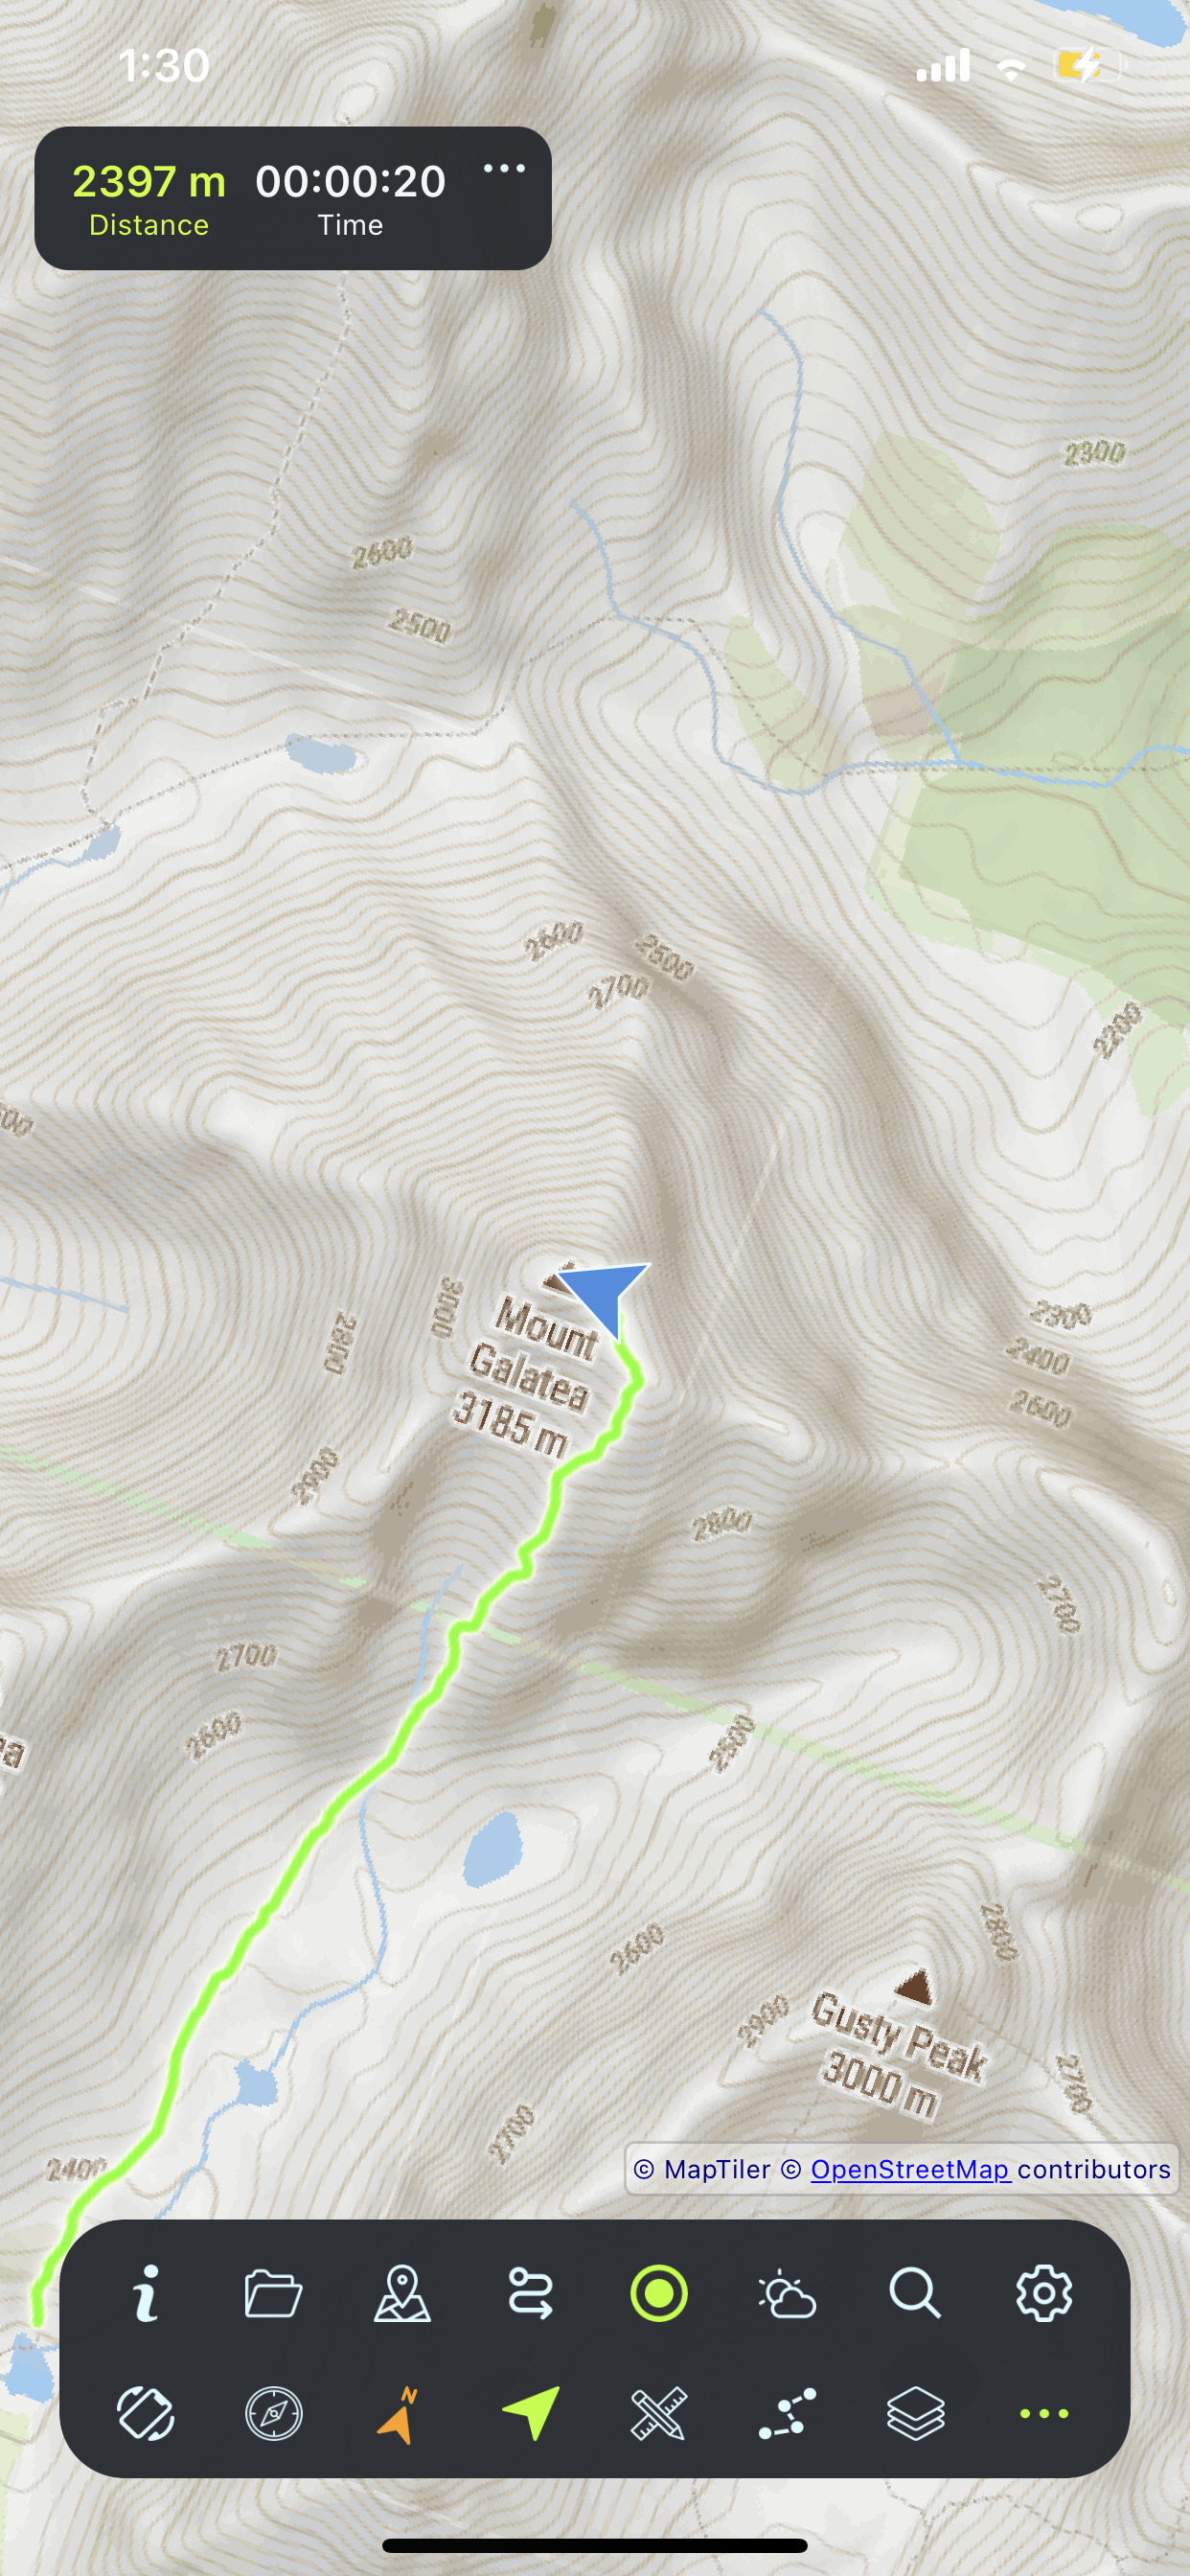
Follow Location
Keep map centered on your GPS position
Rotate with Device
Map rotates with compass for heading-up view
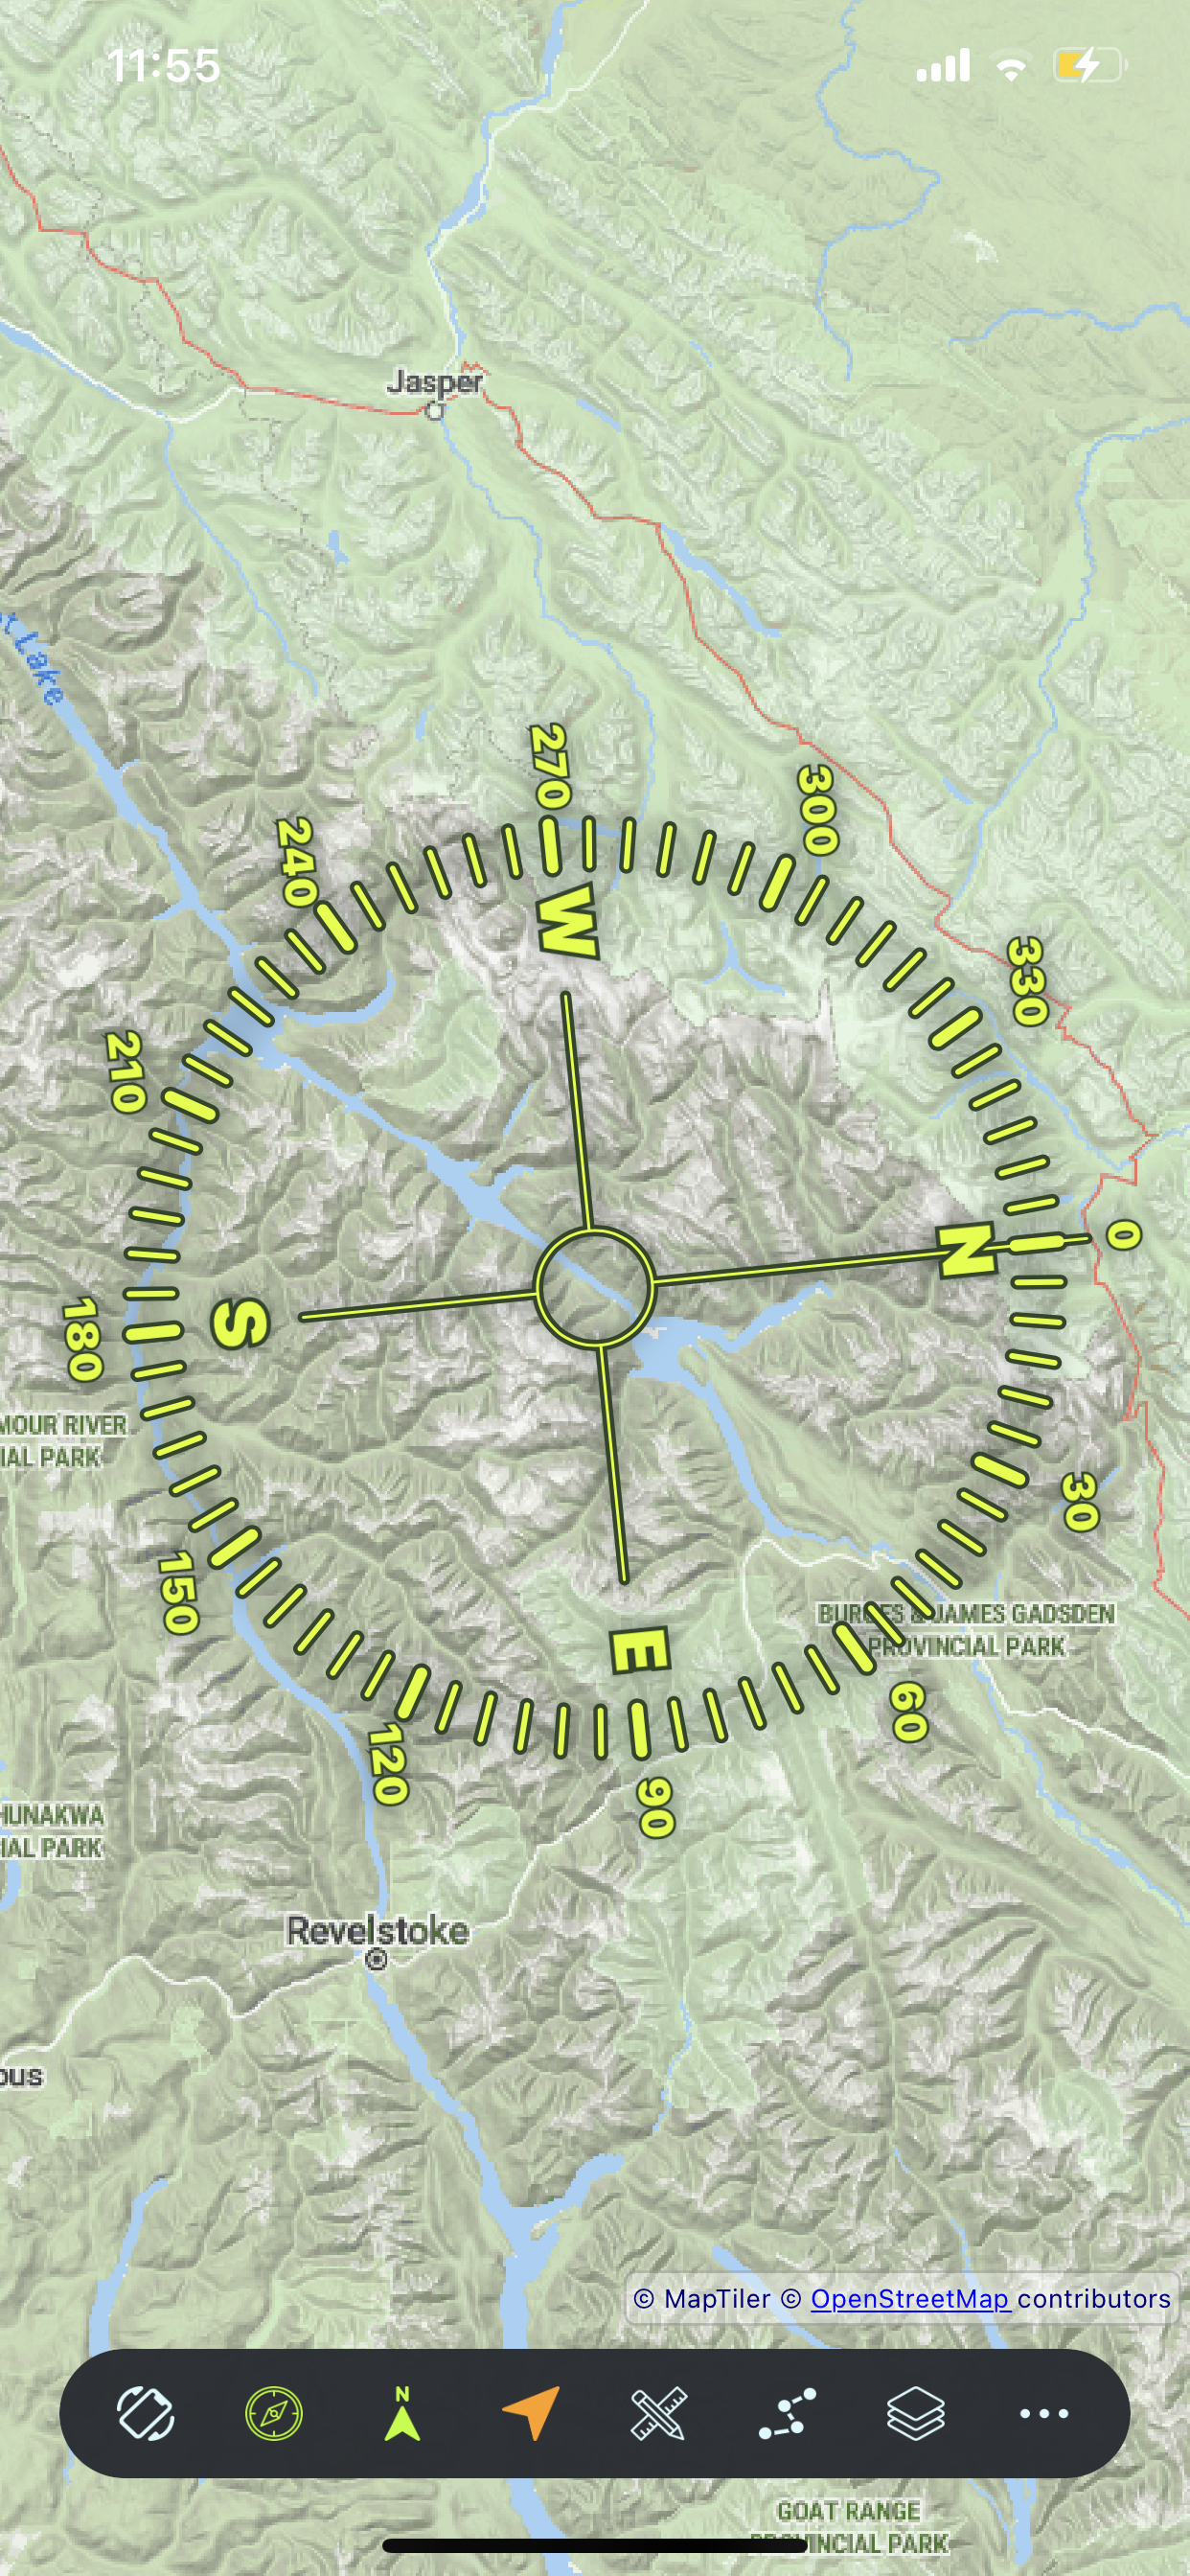
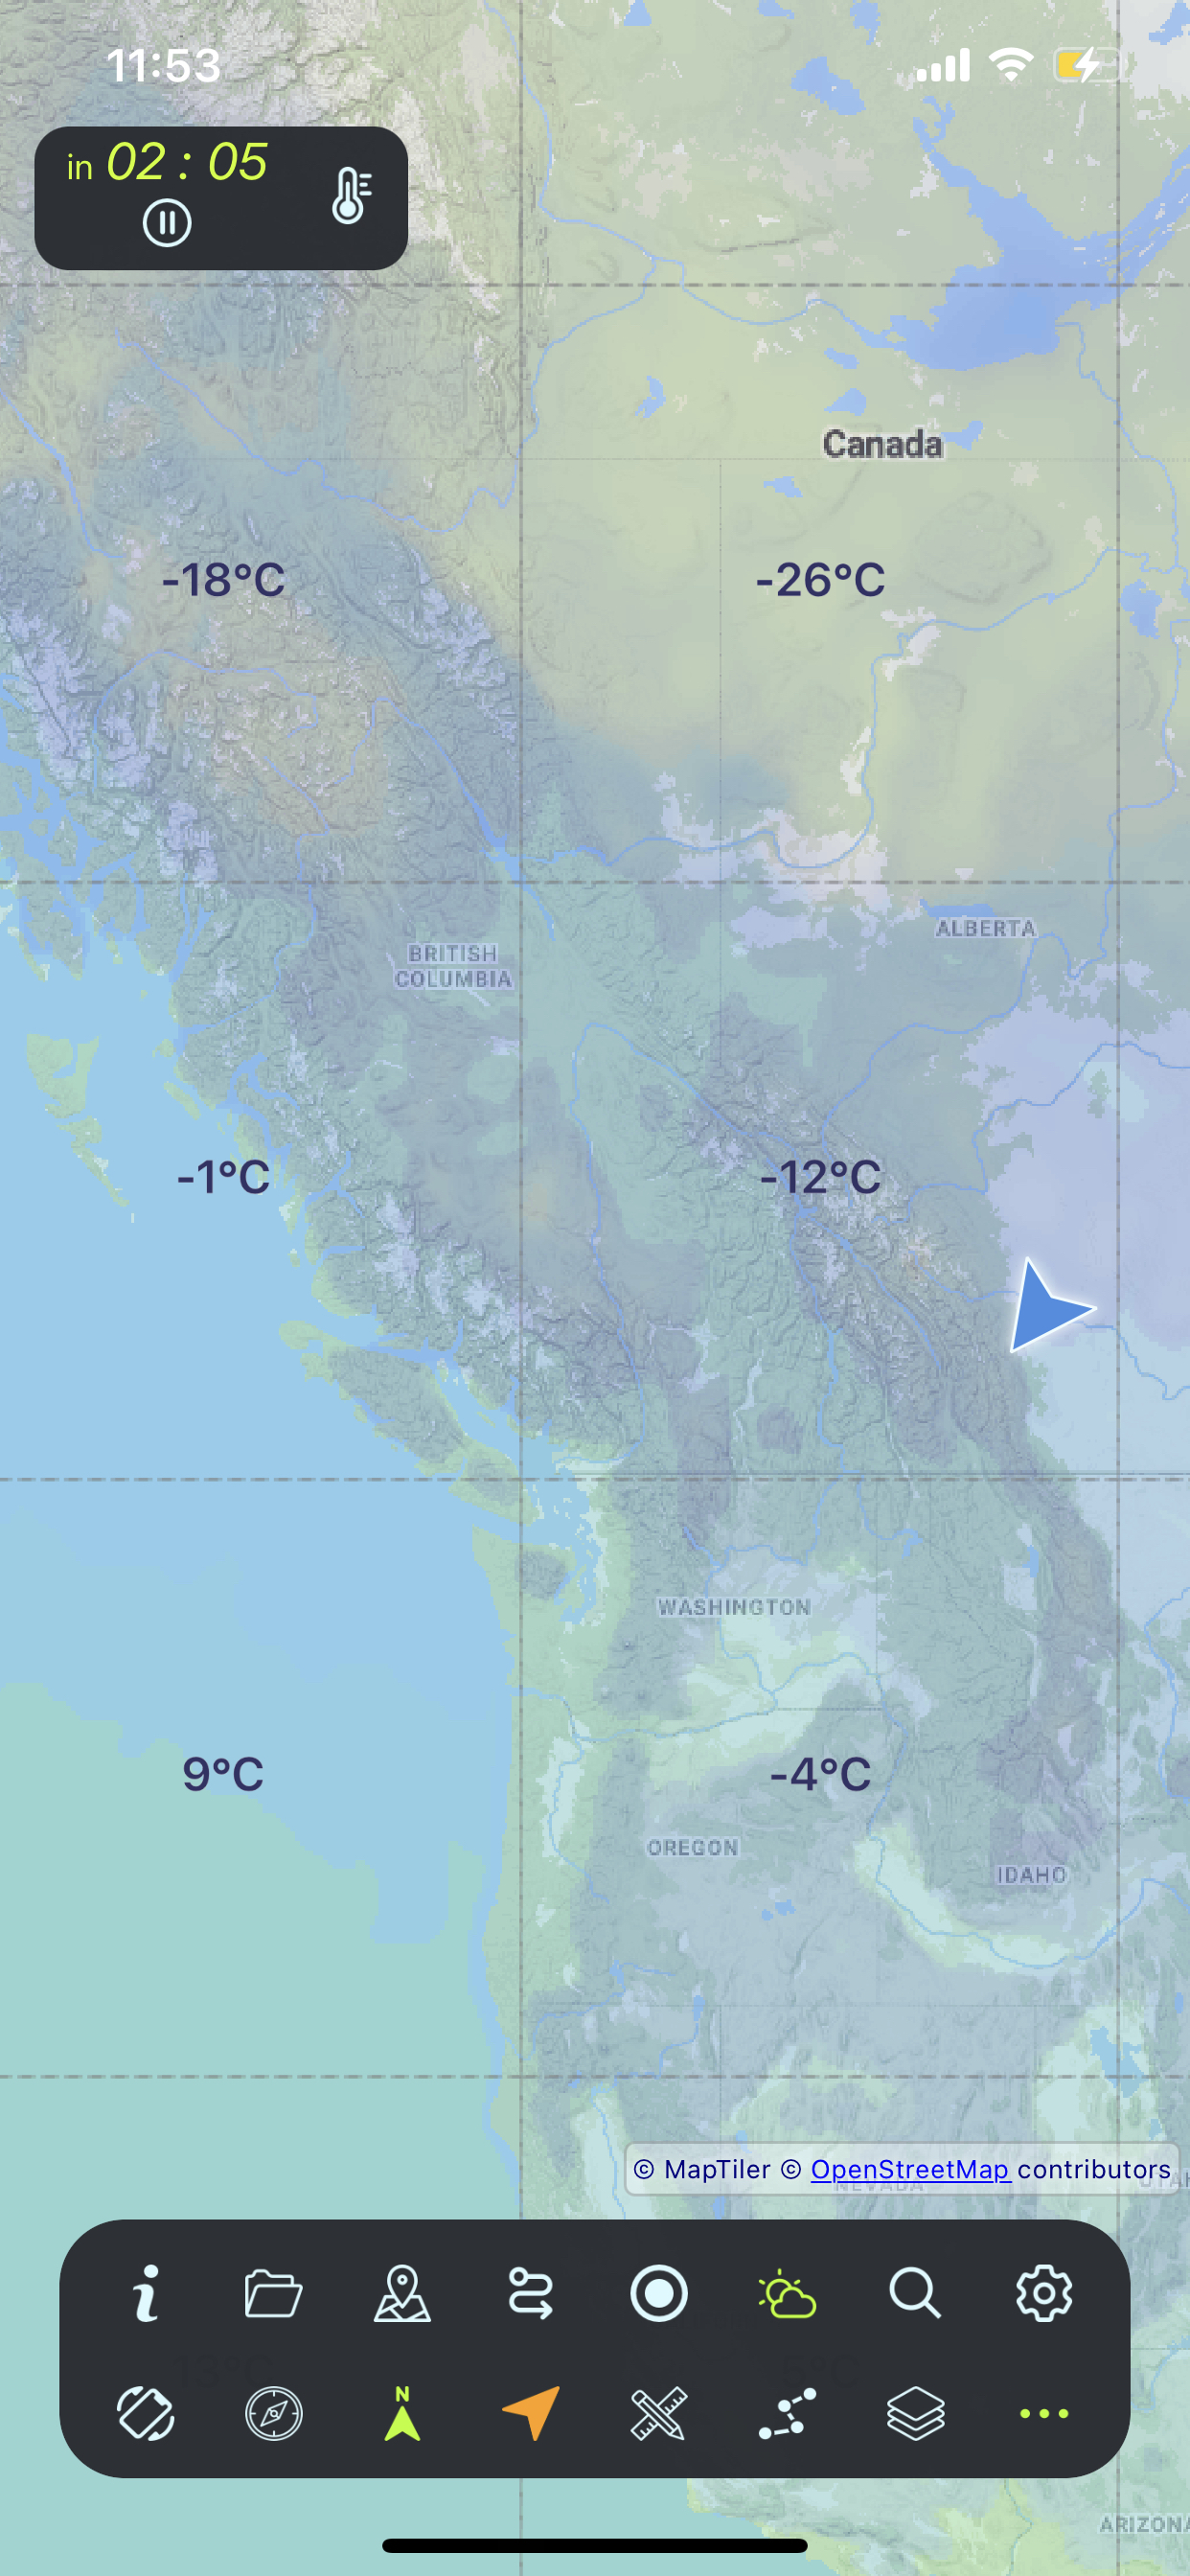
Compass
On-screen compass shows north direction
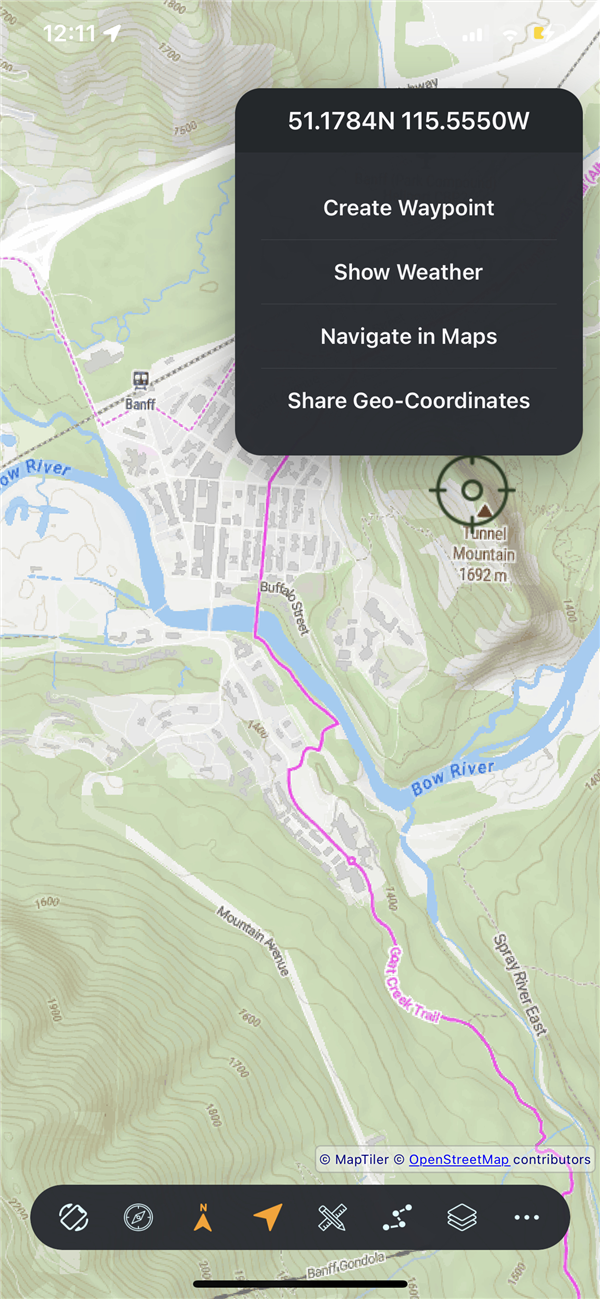
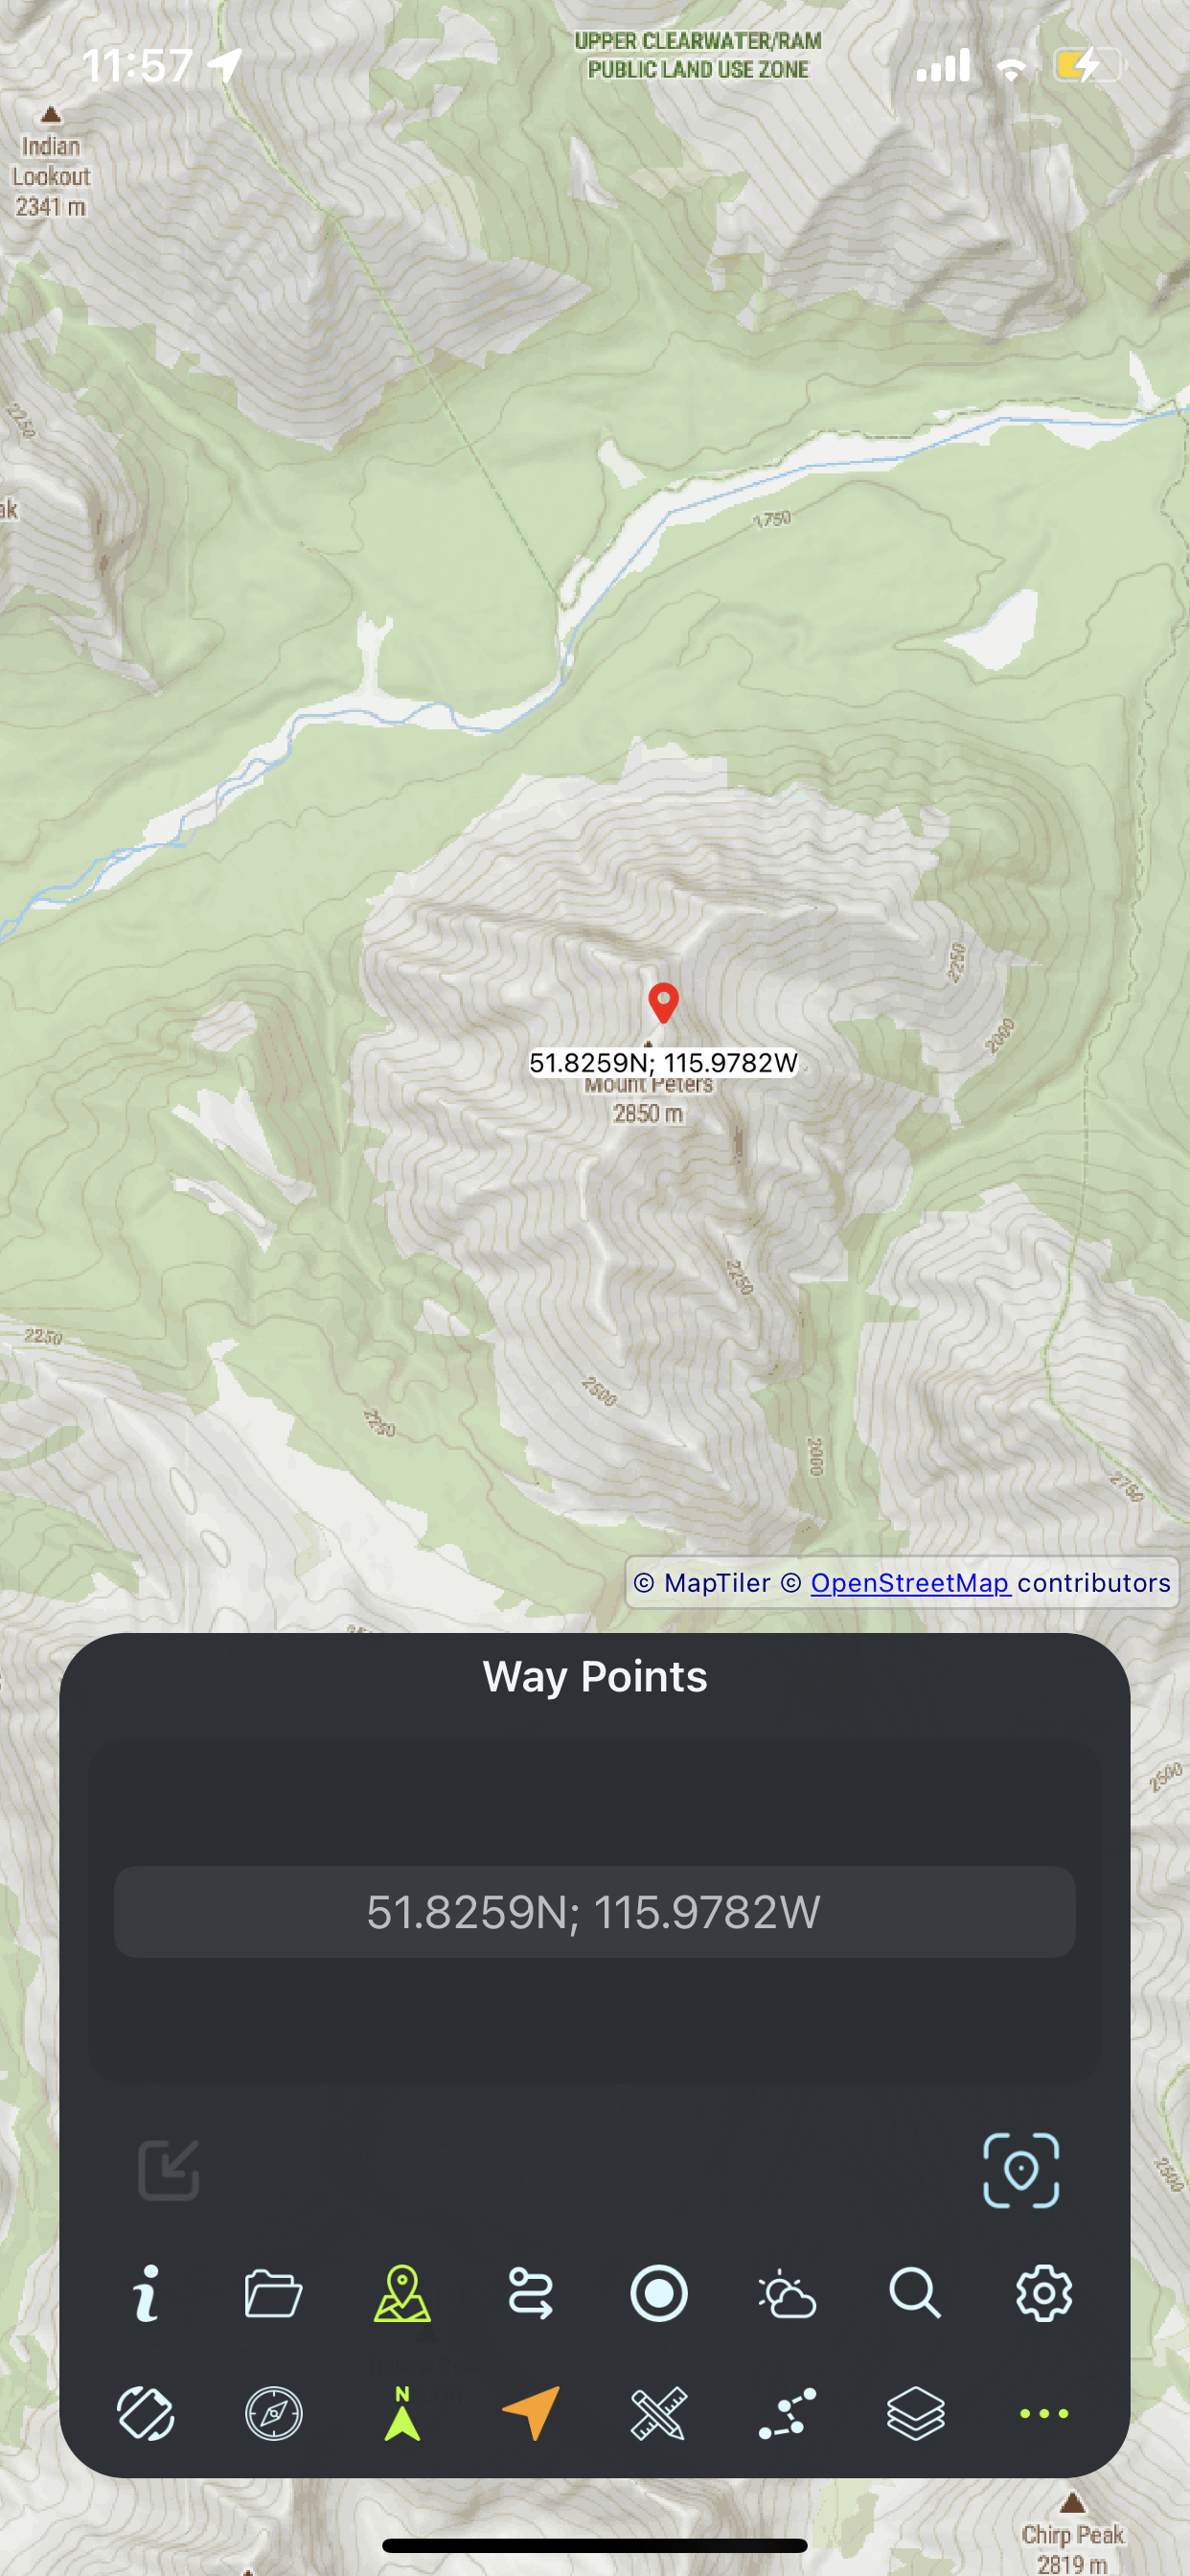
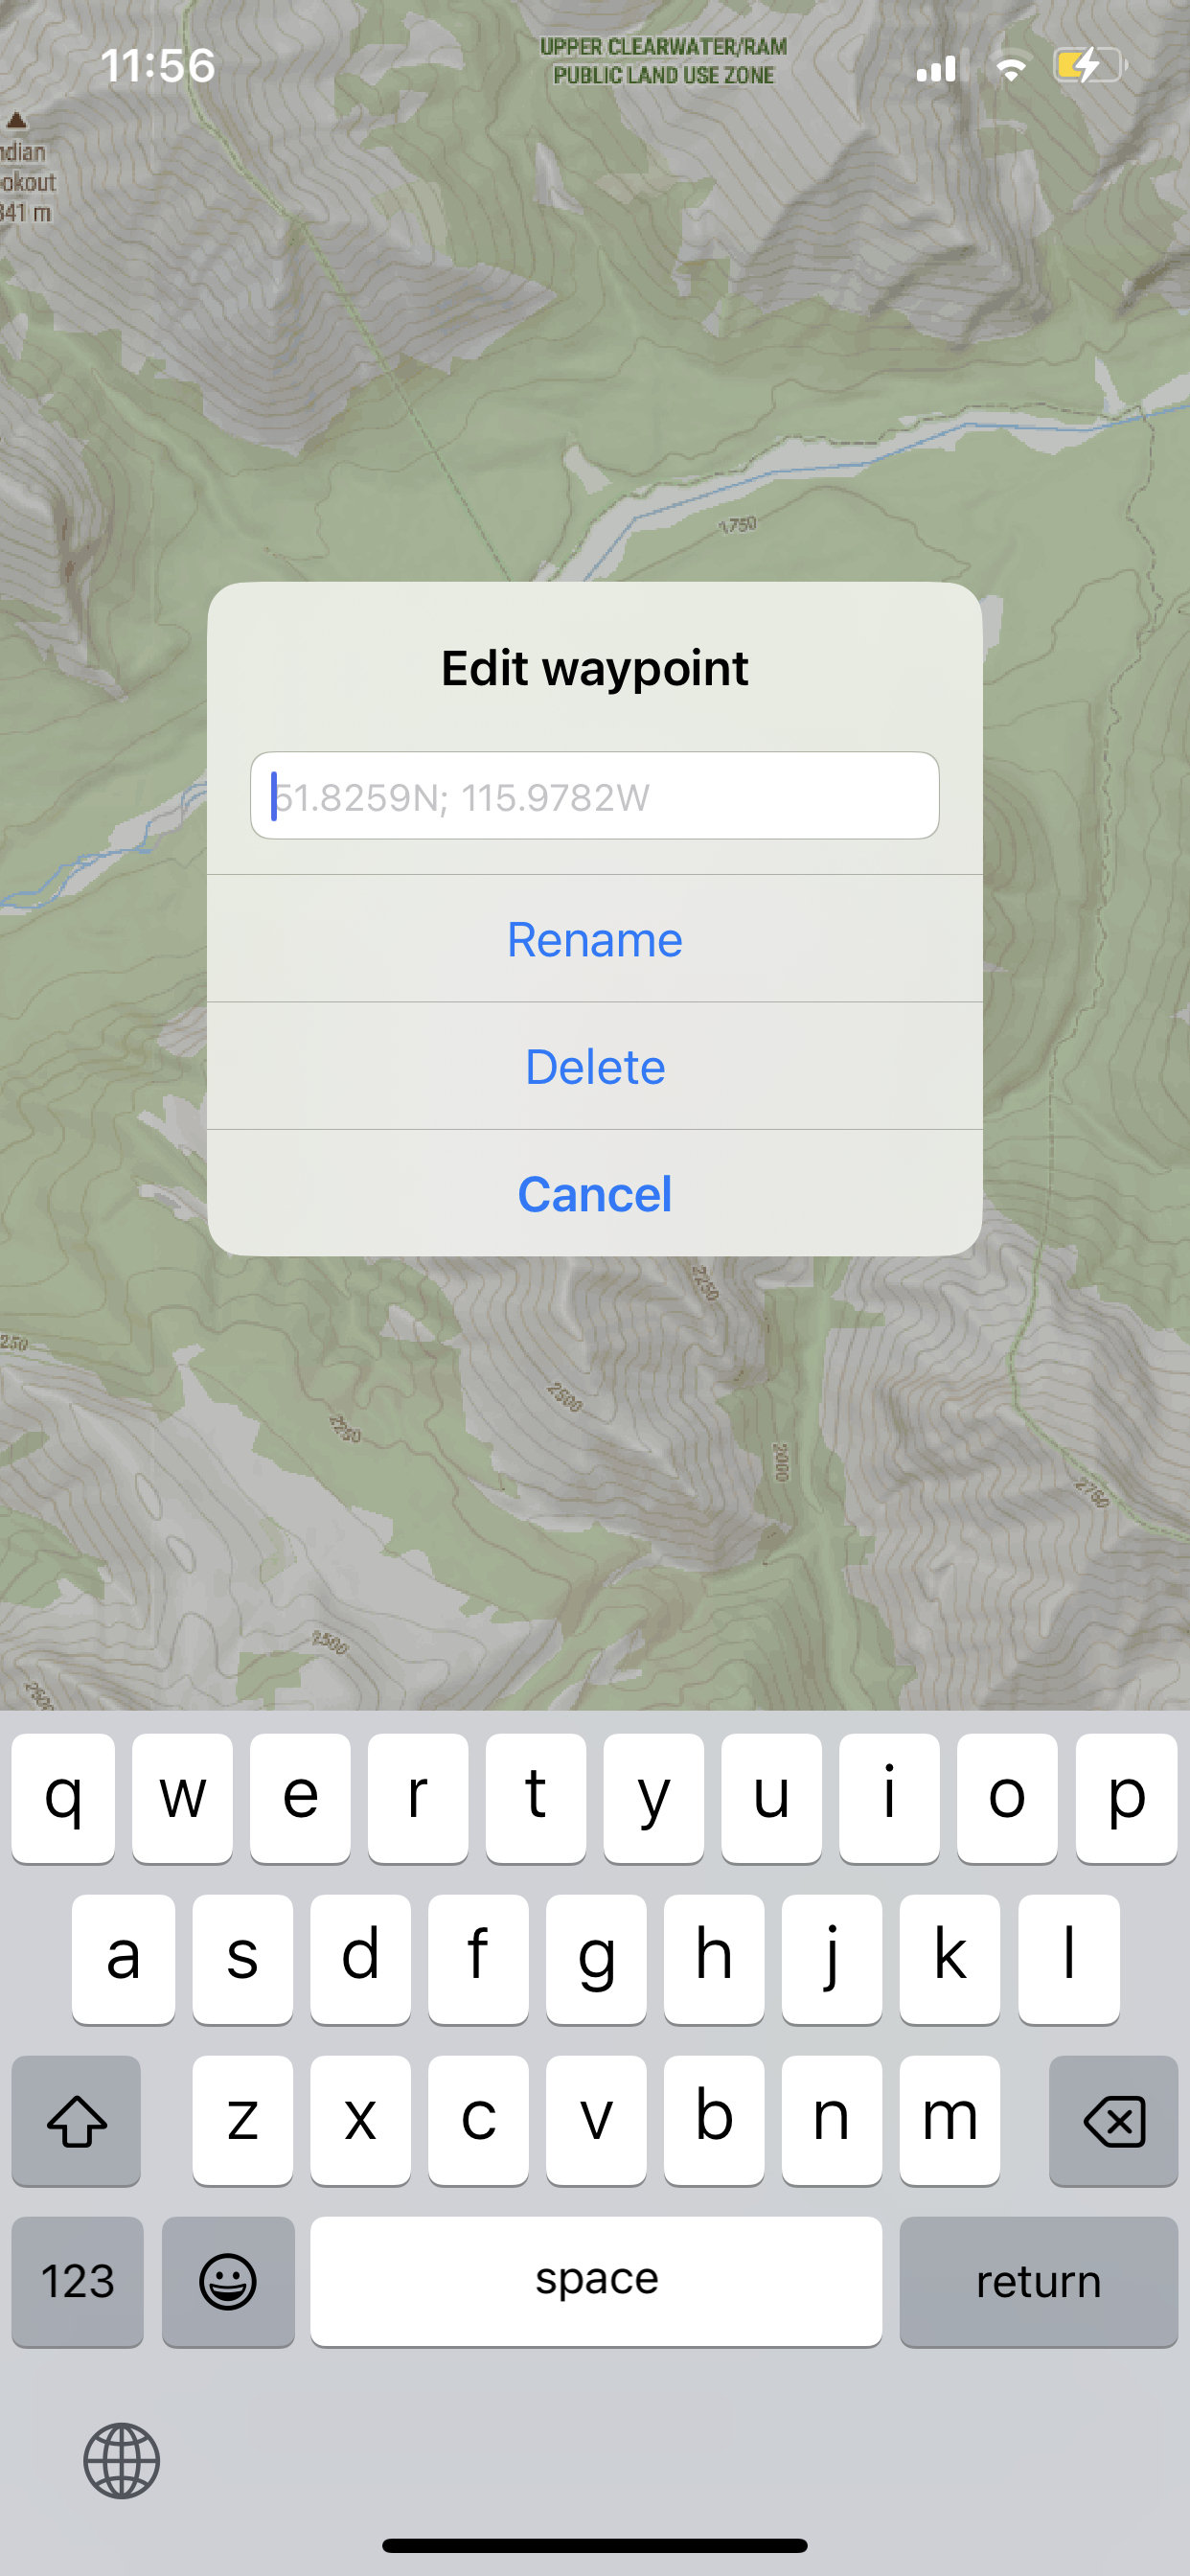
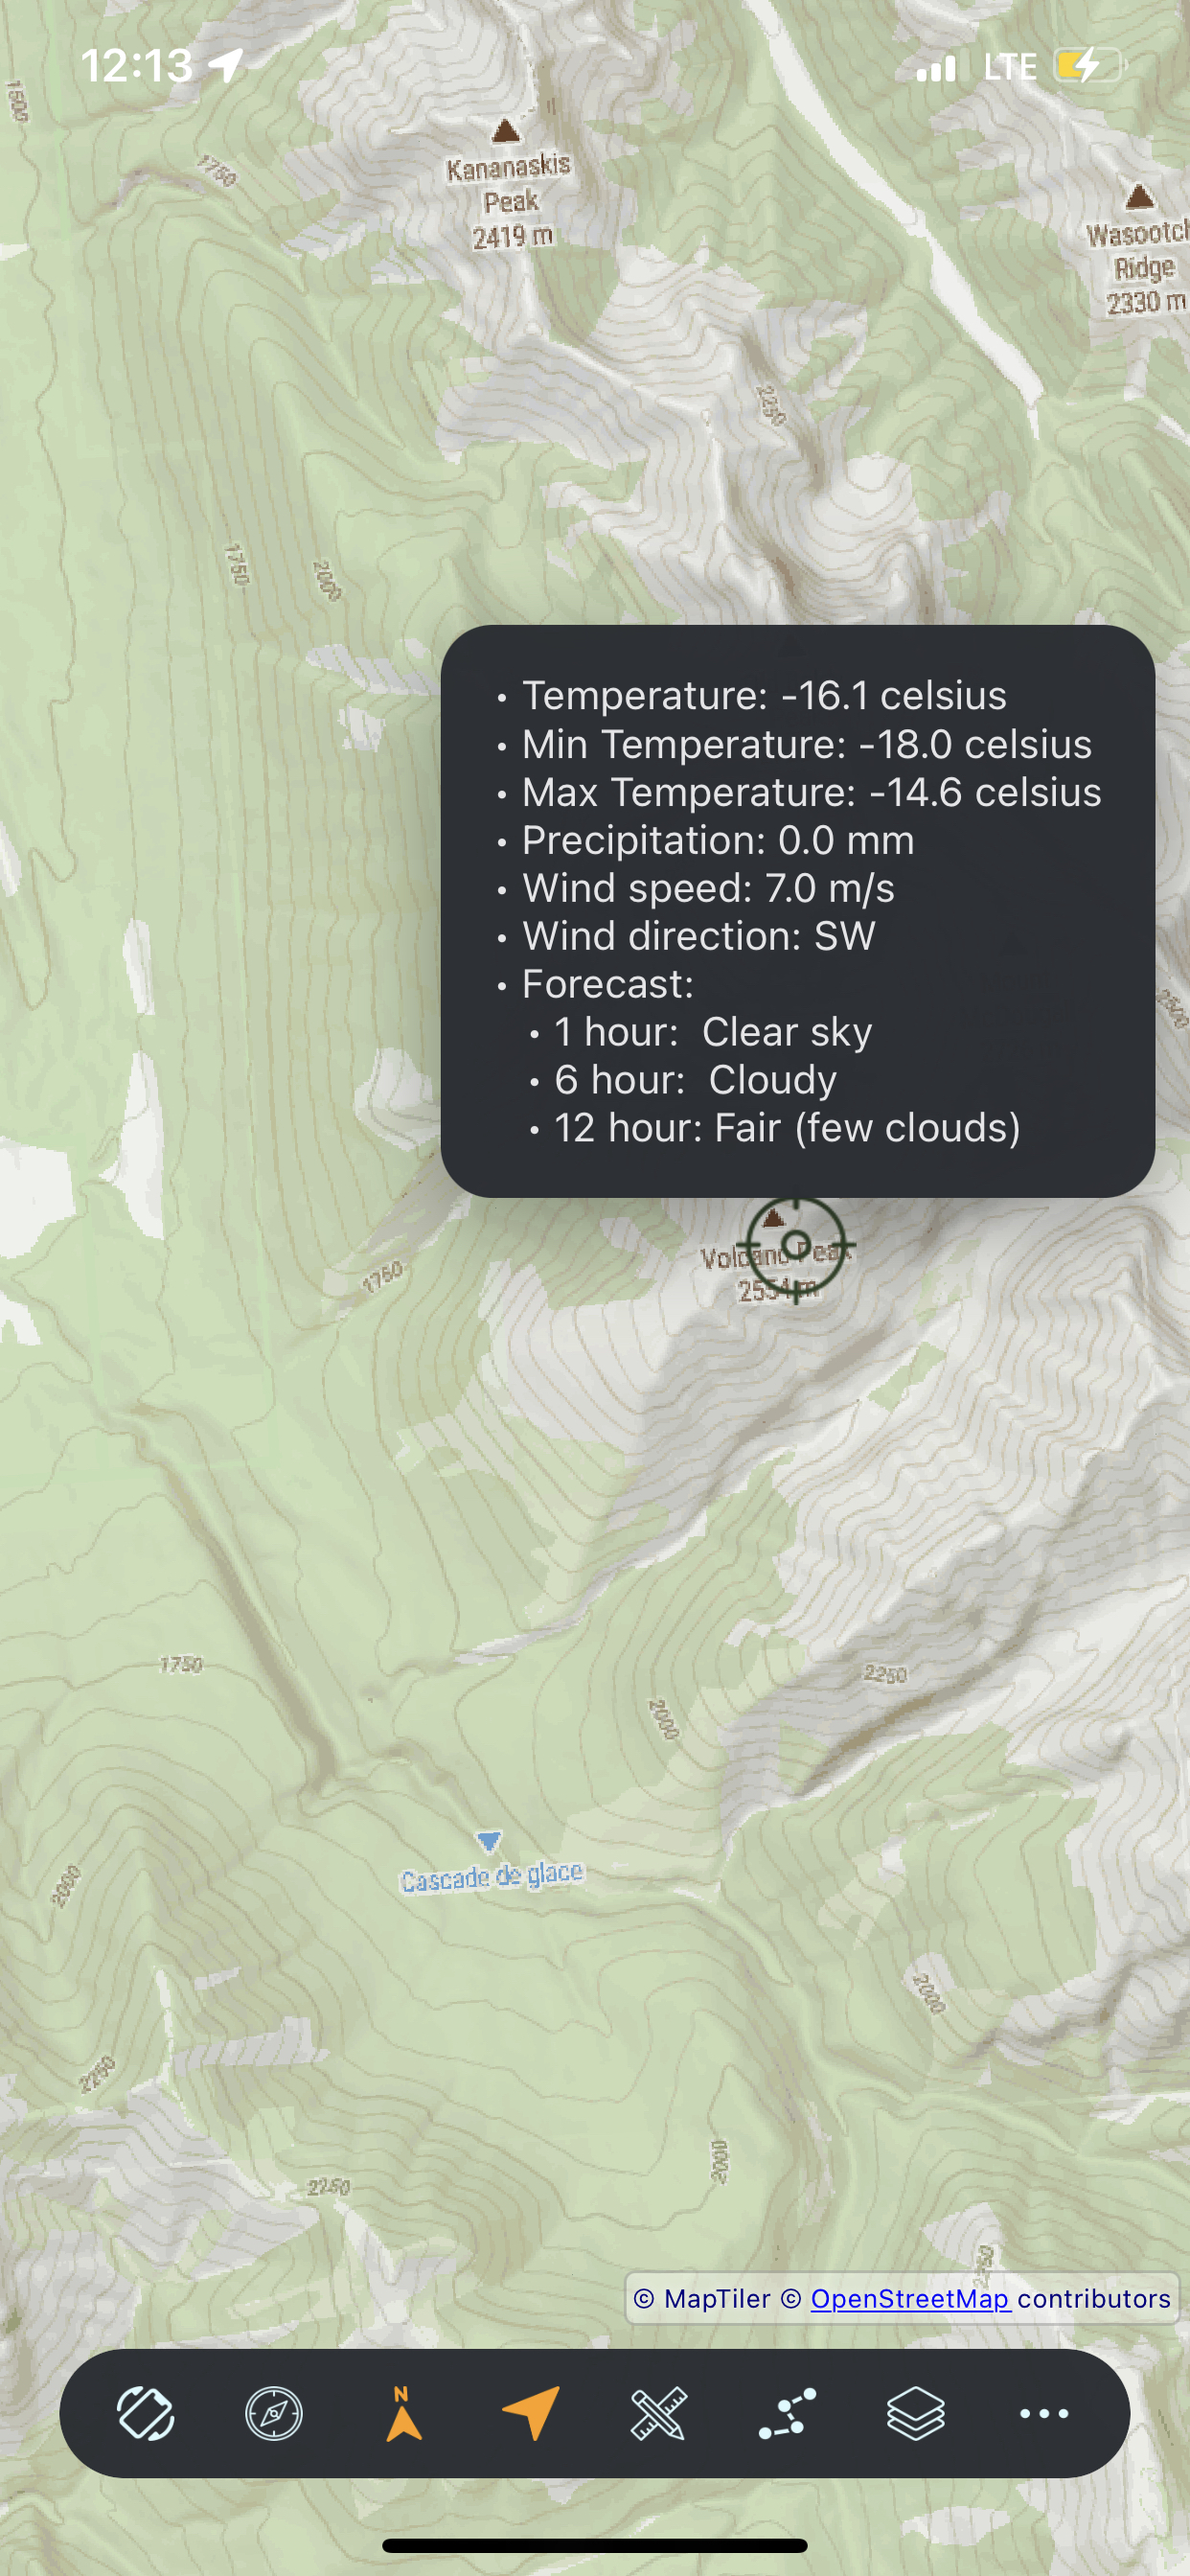
Context Menu
Long-press for waypoint, weather, navigation
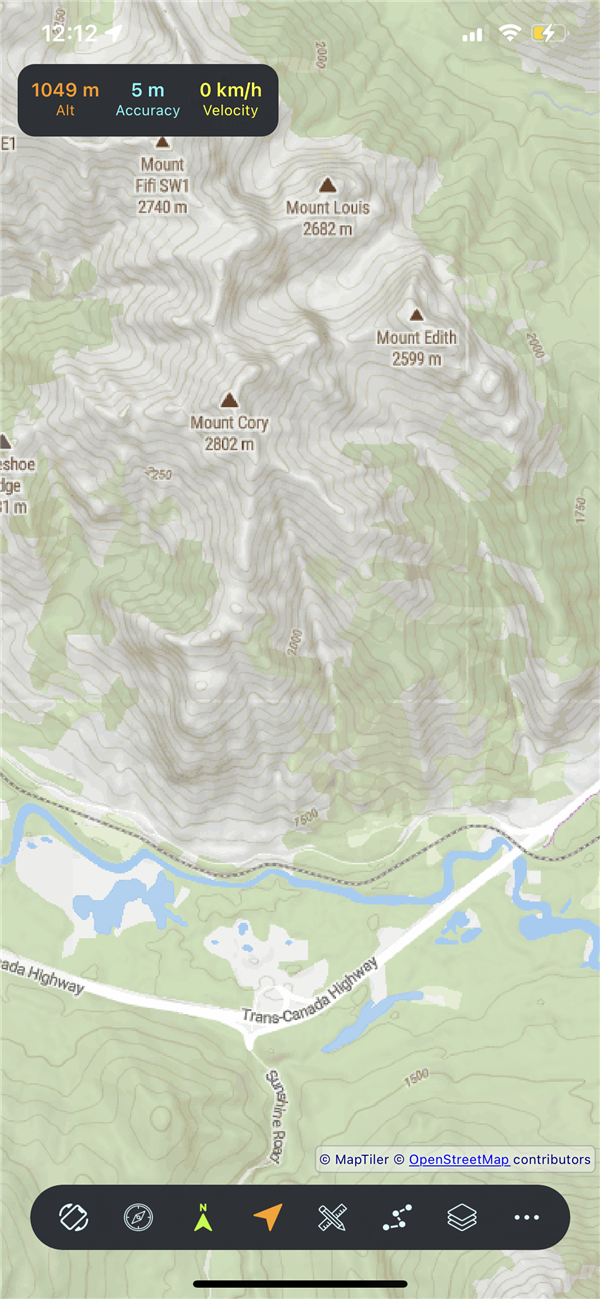
Info Panel
Real-time altitude, velocity, and GPS accuracy display
OSM Trail Discovery & Search
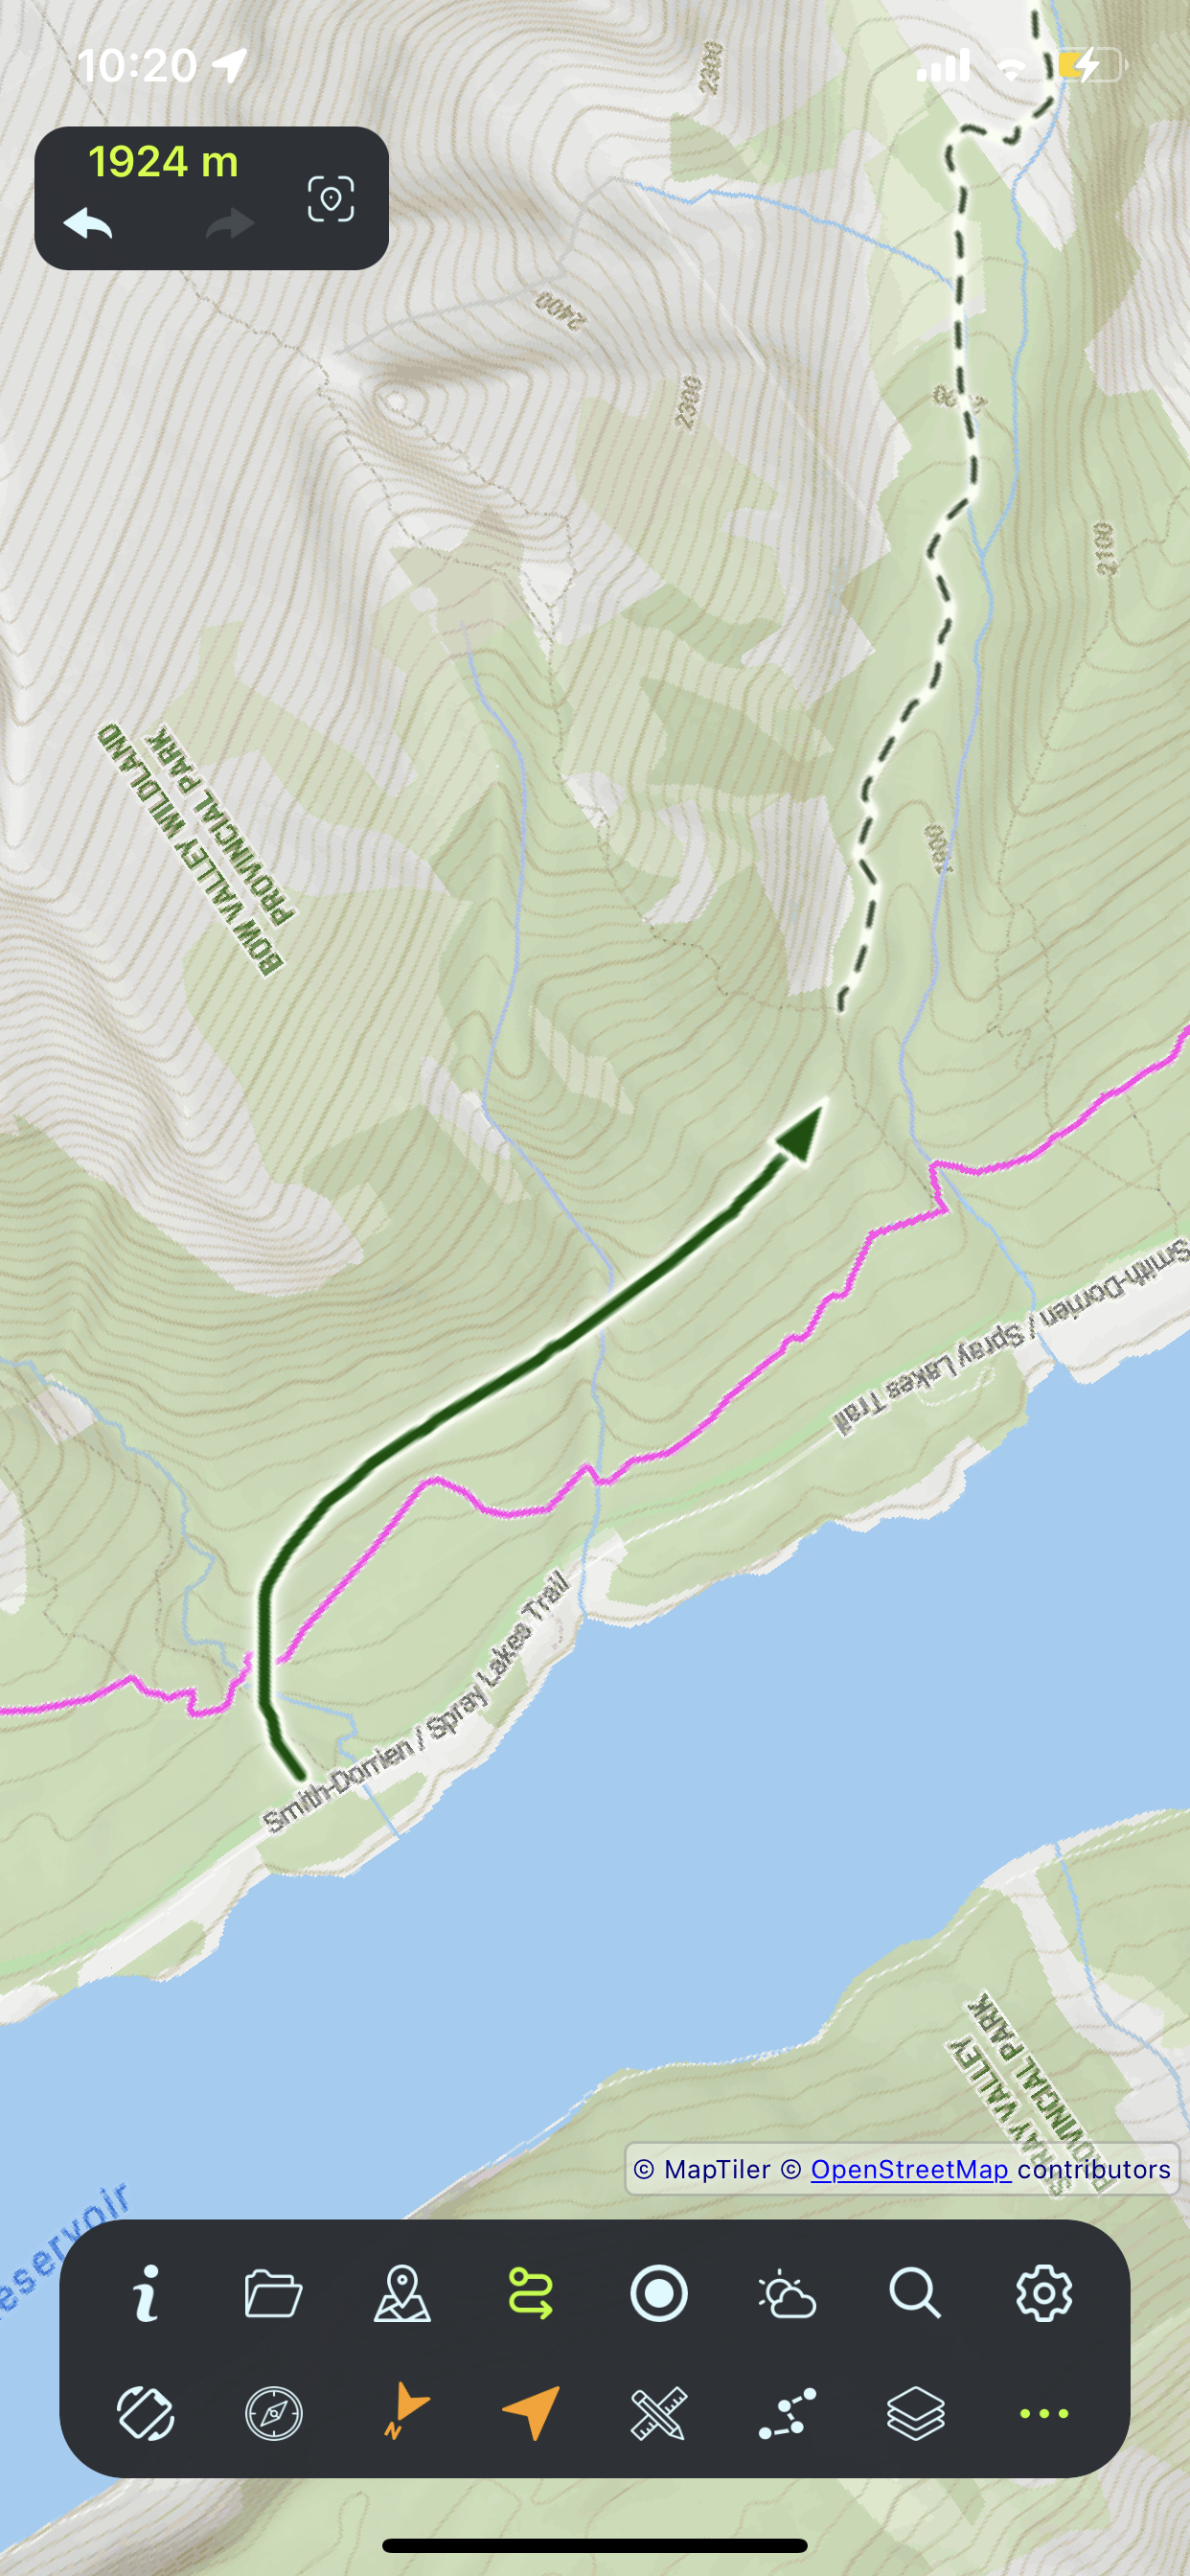
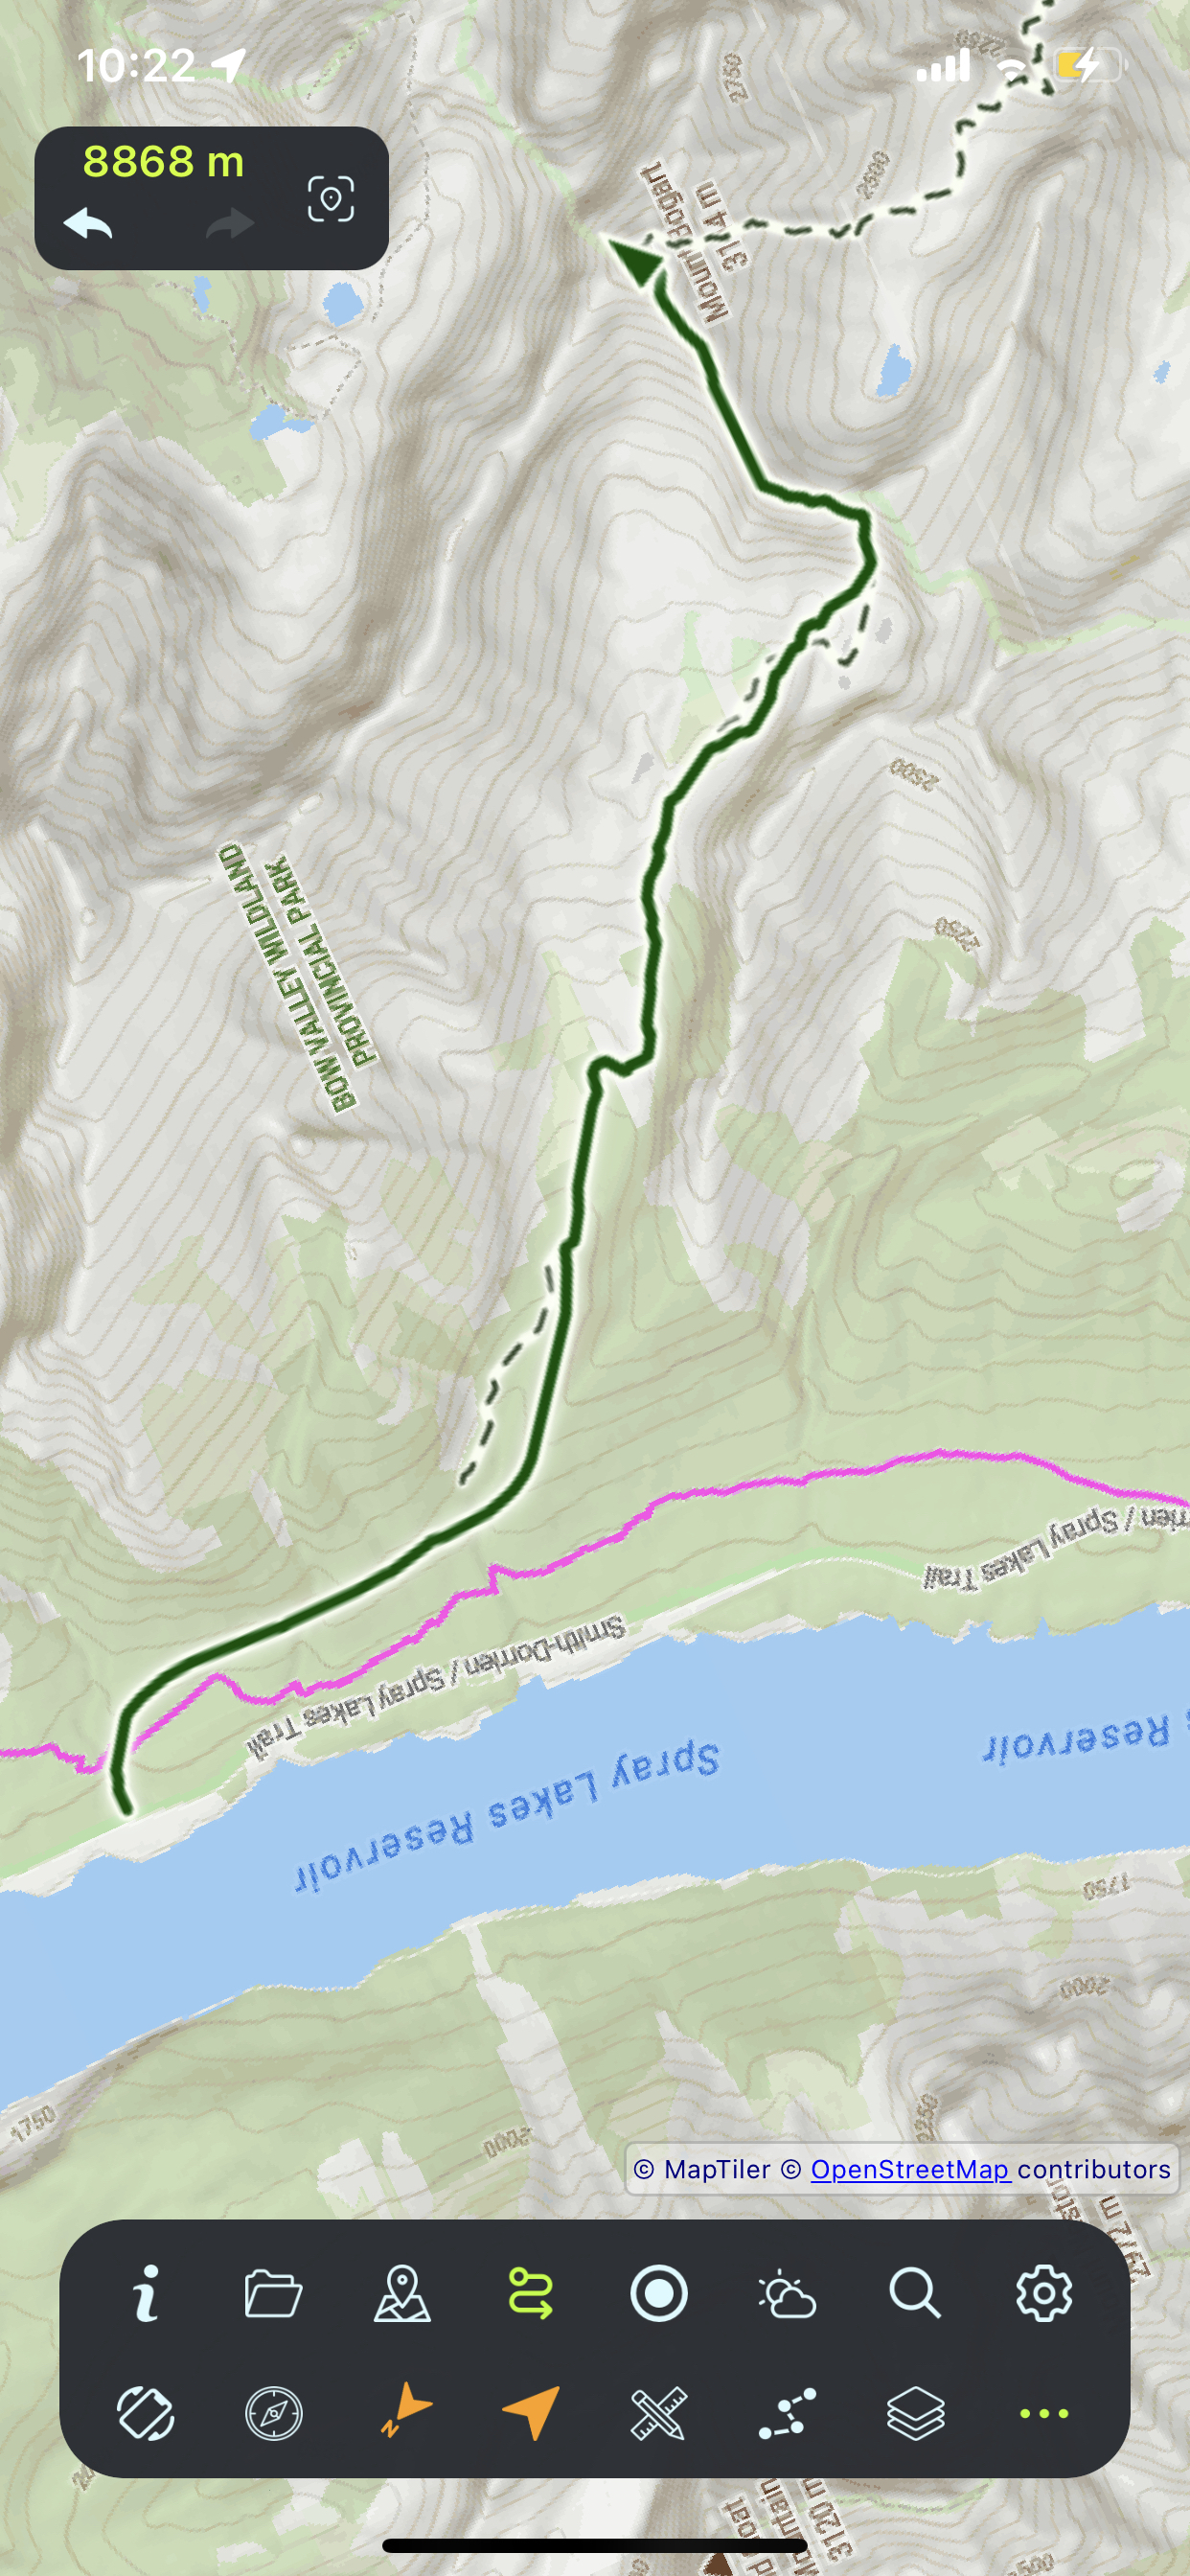
OSM Trail Highlight
Via Trails > Finder: highlight all OpenStreetMap trails in visible area — tap any to view info
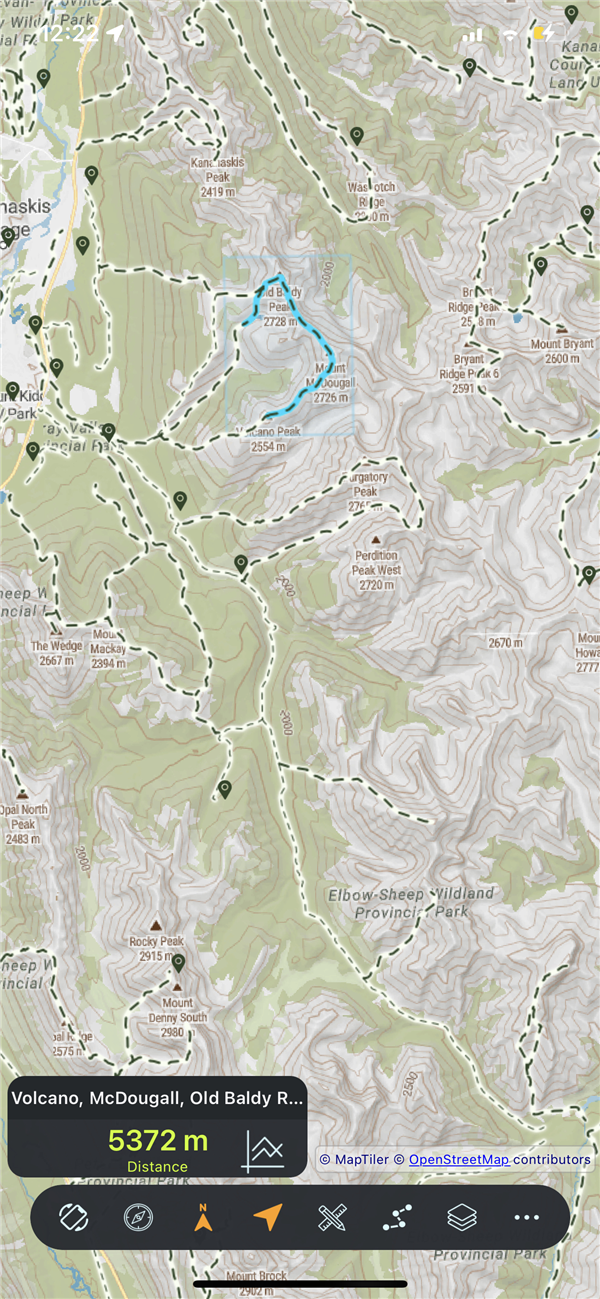
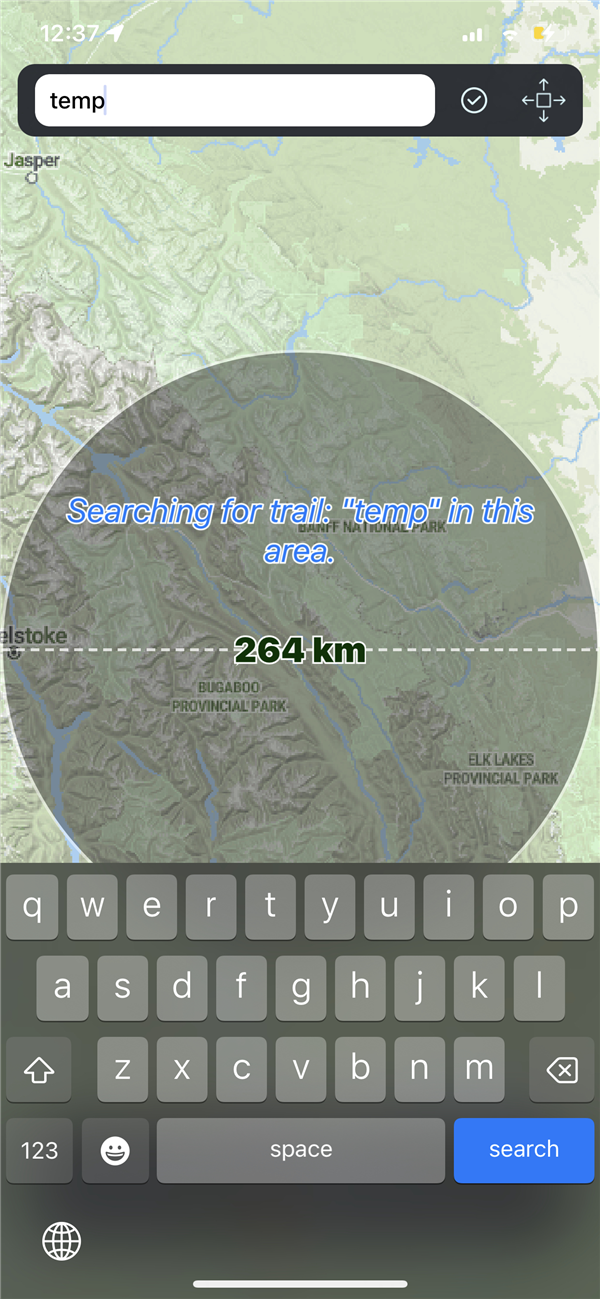
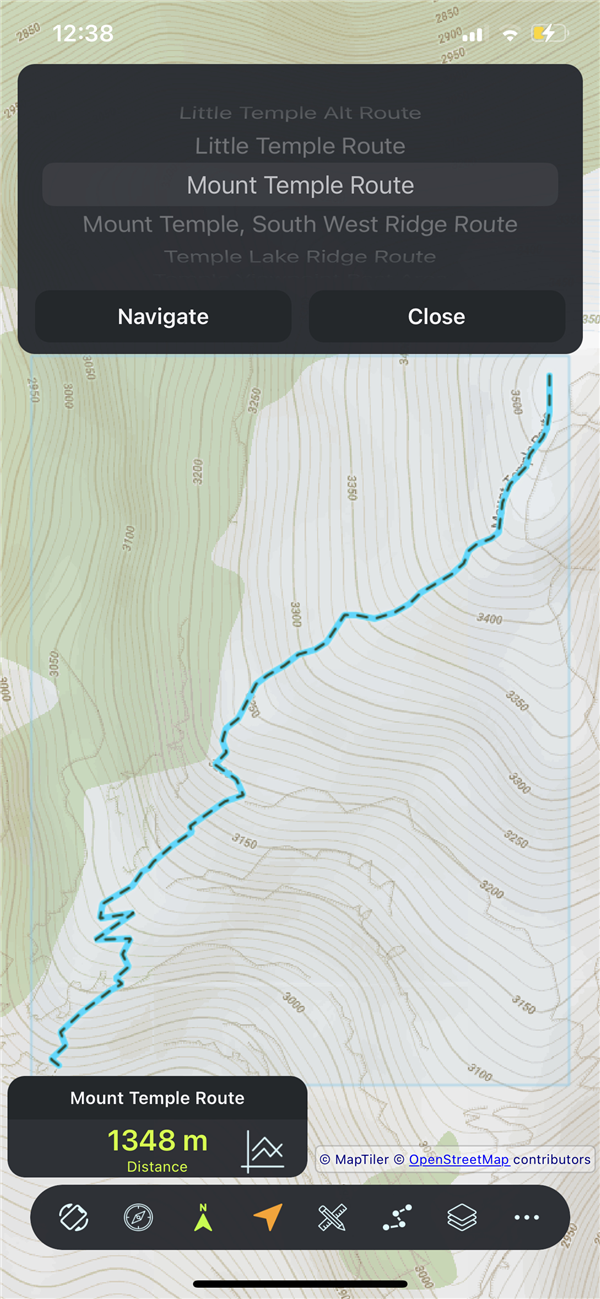
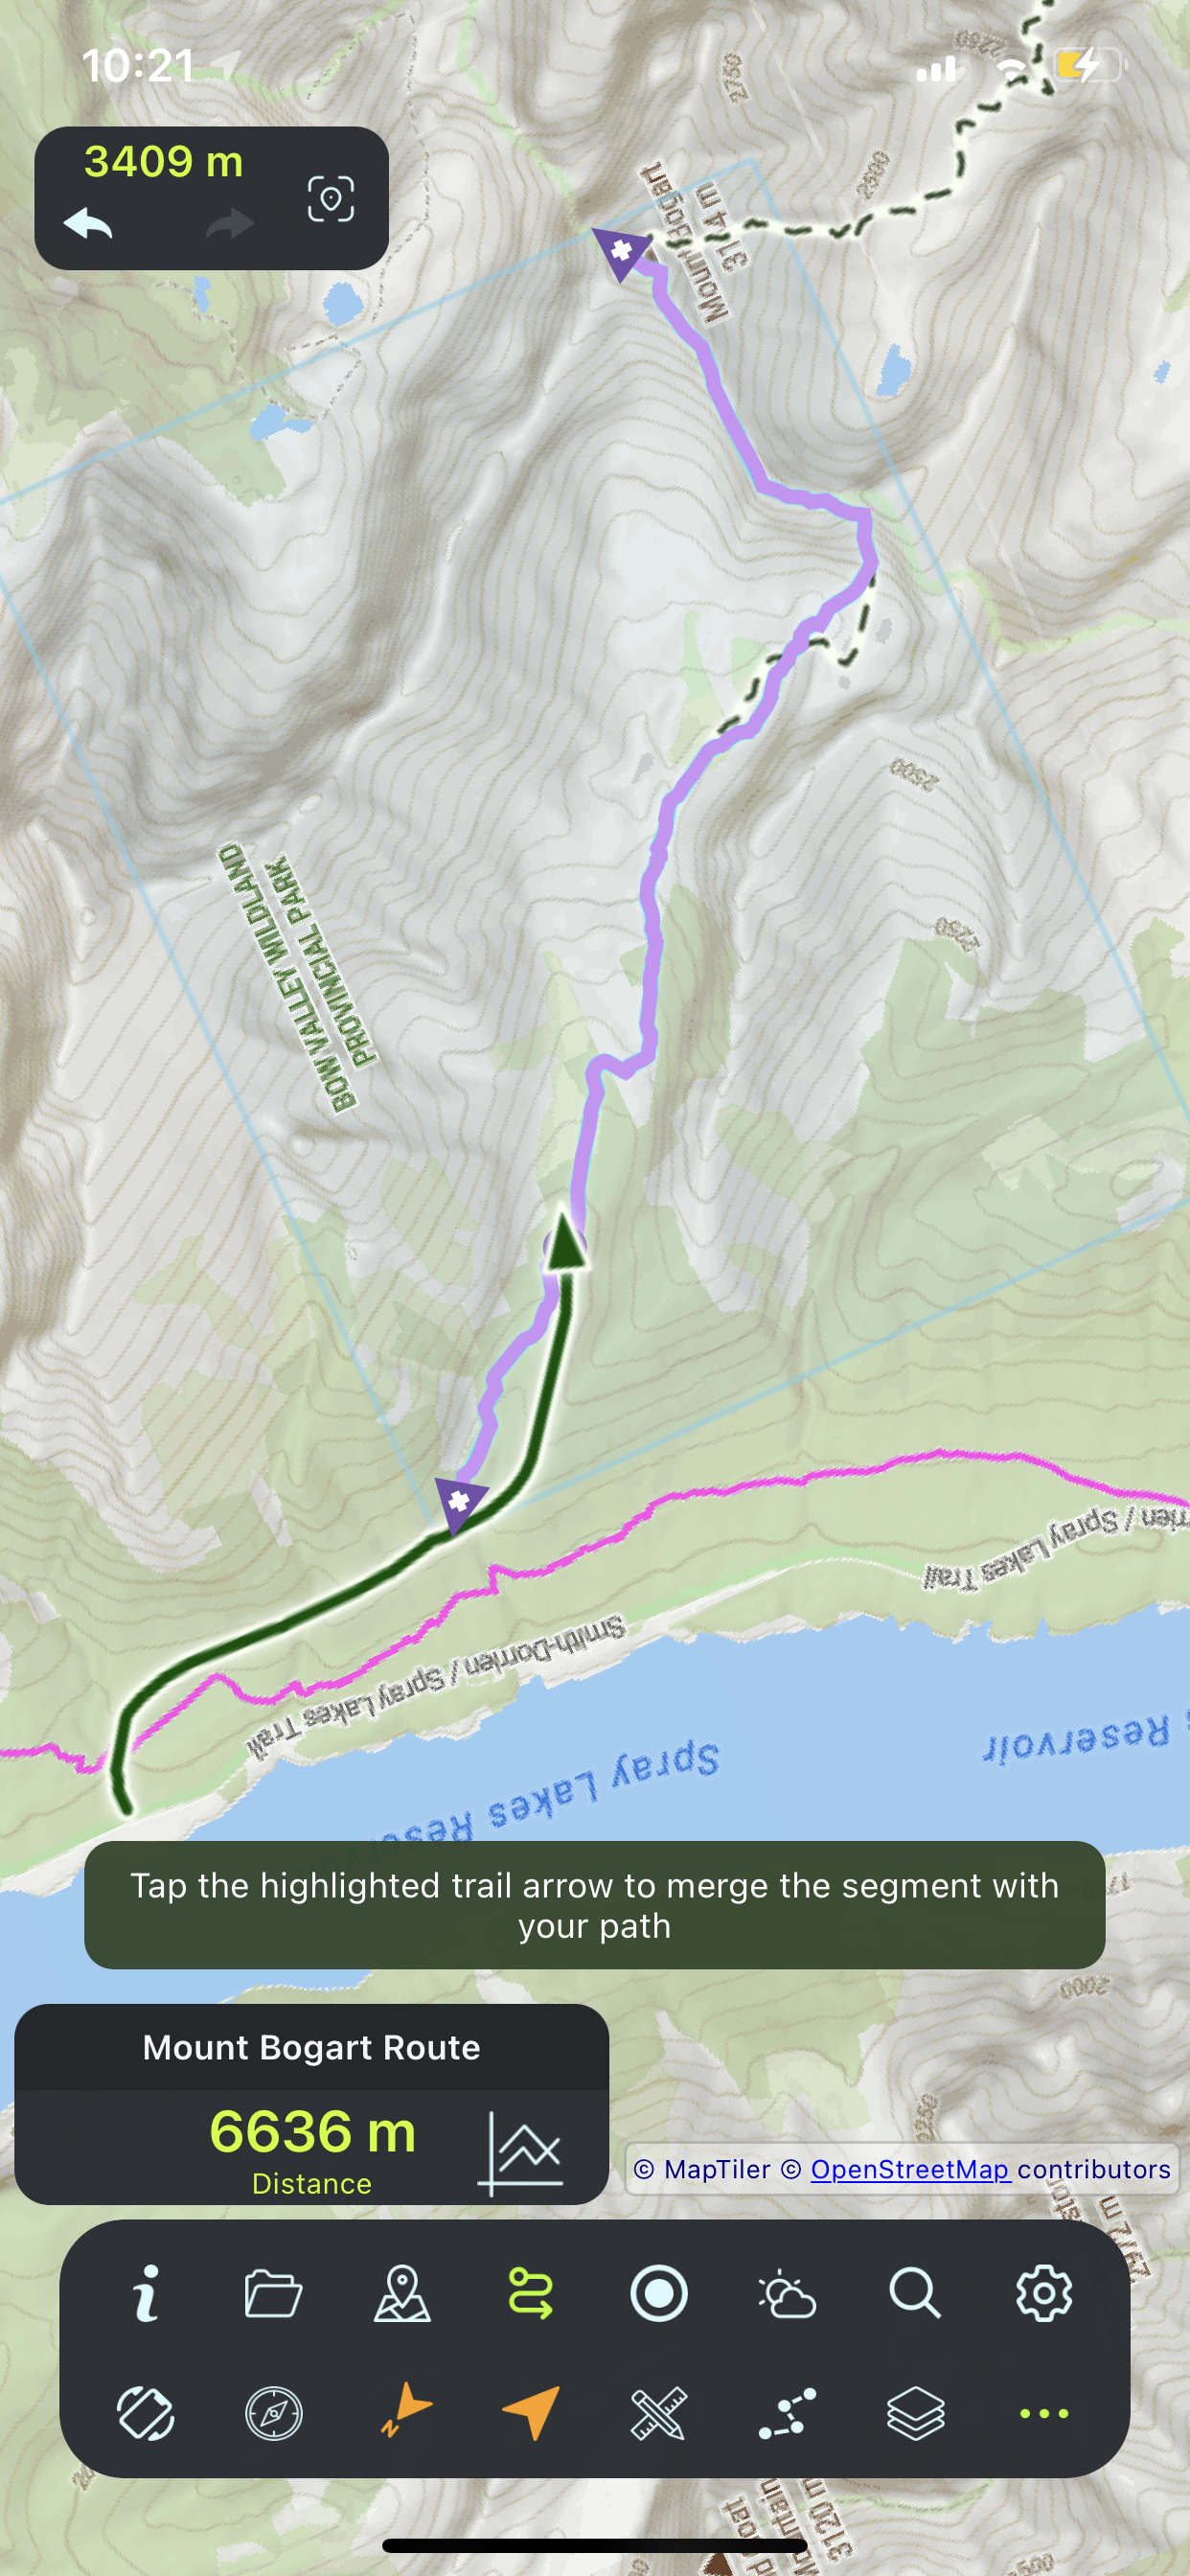
Trail Search by Name
Via Trails > Finder: search by full or partial trail name in the current map view, then navigate or convert to GPX
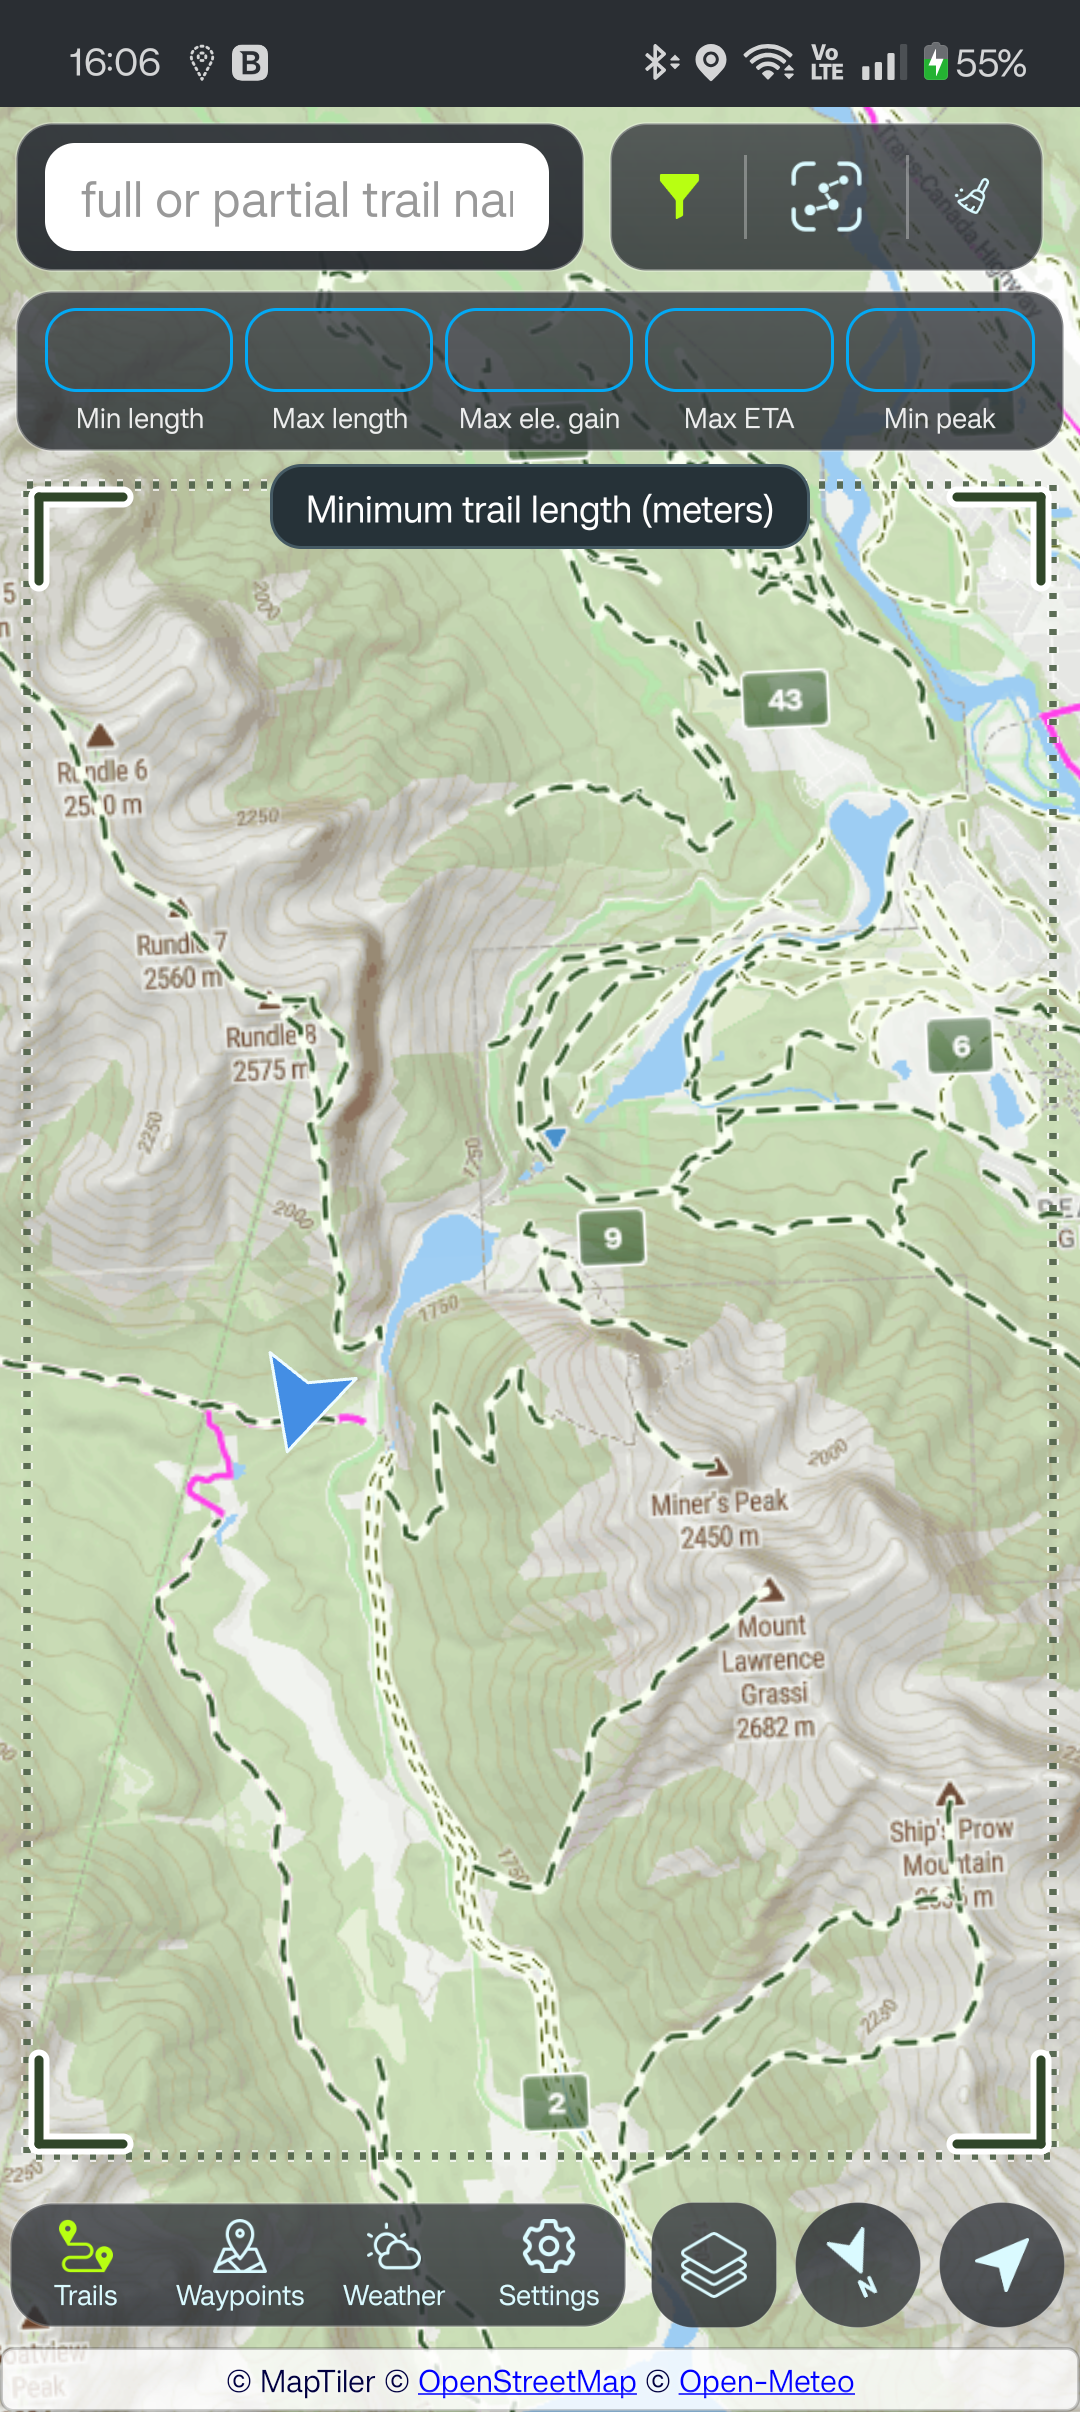
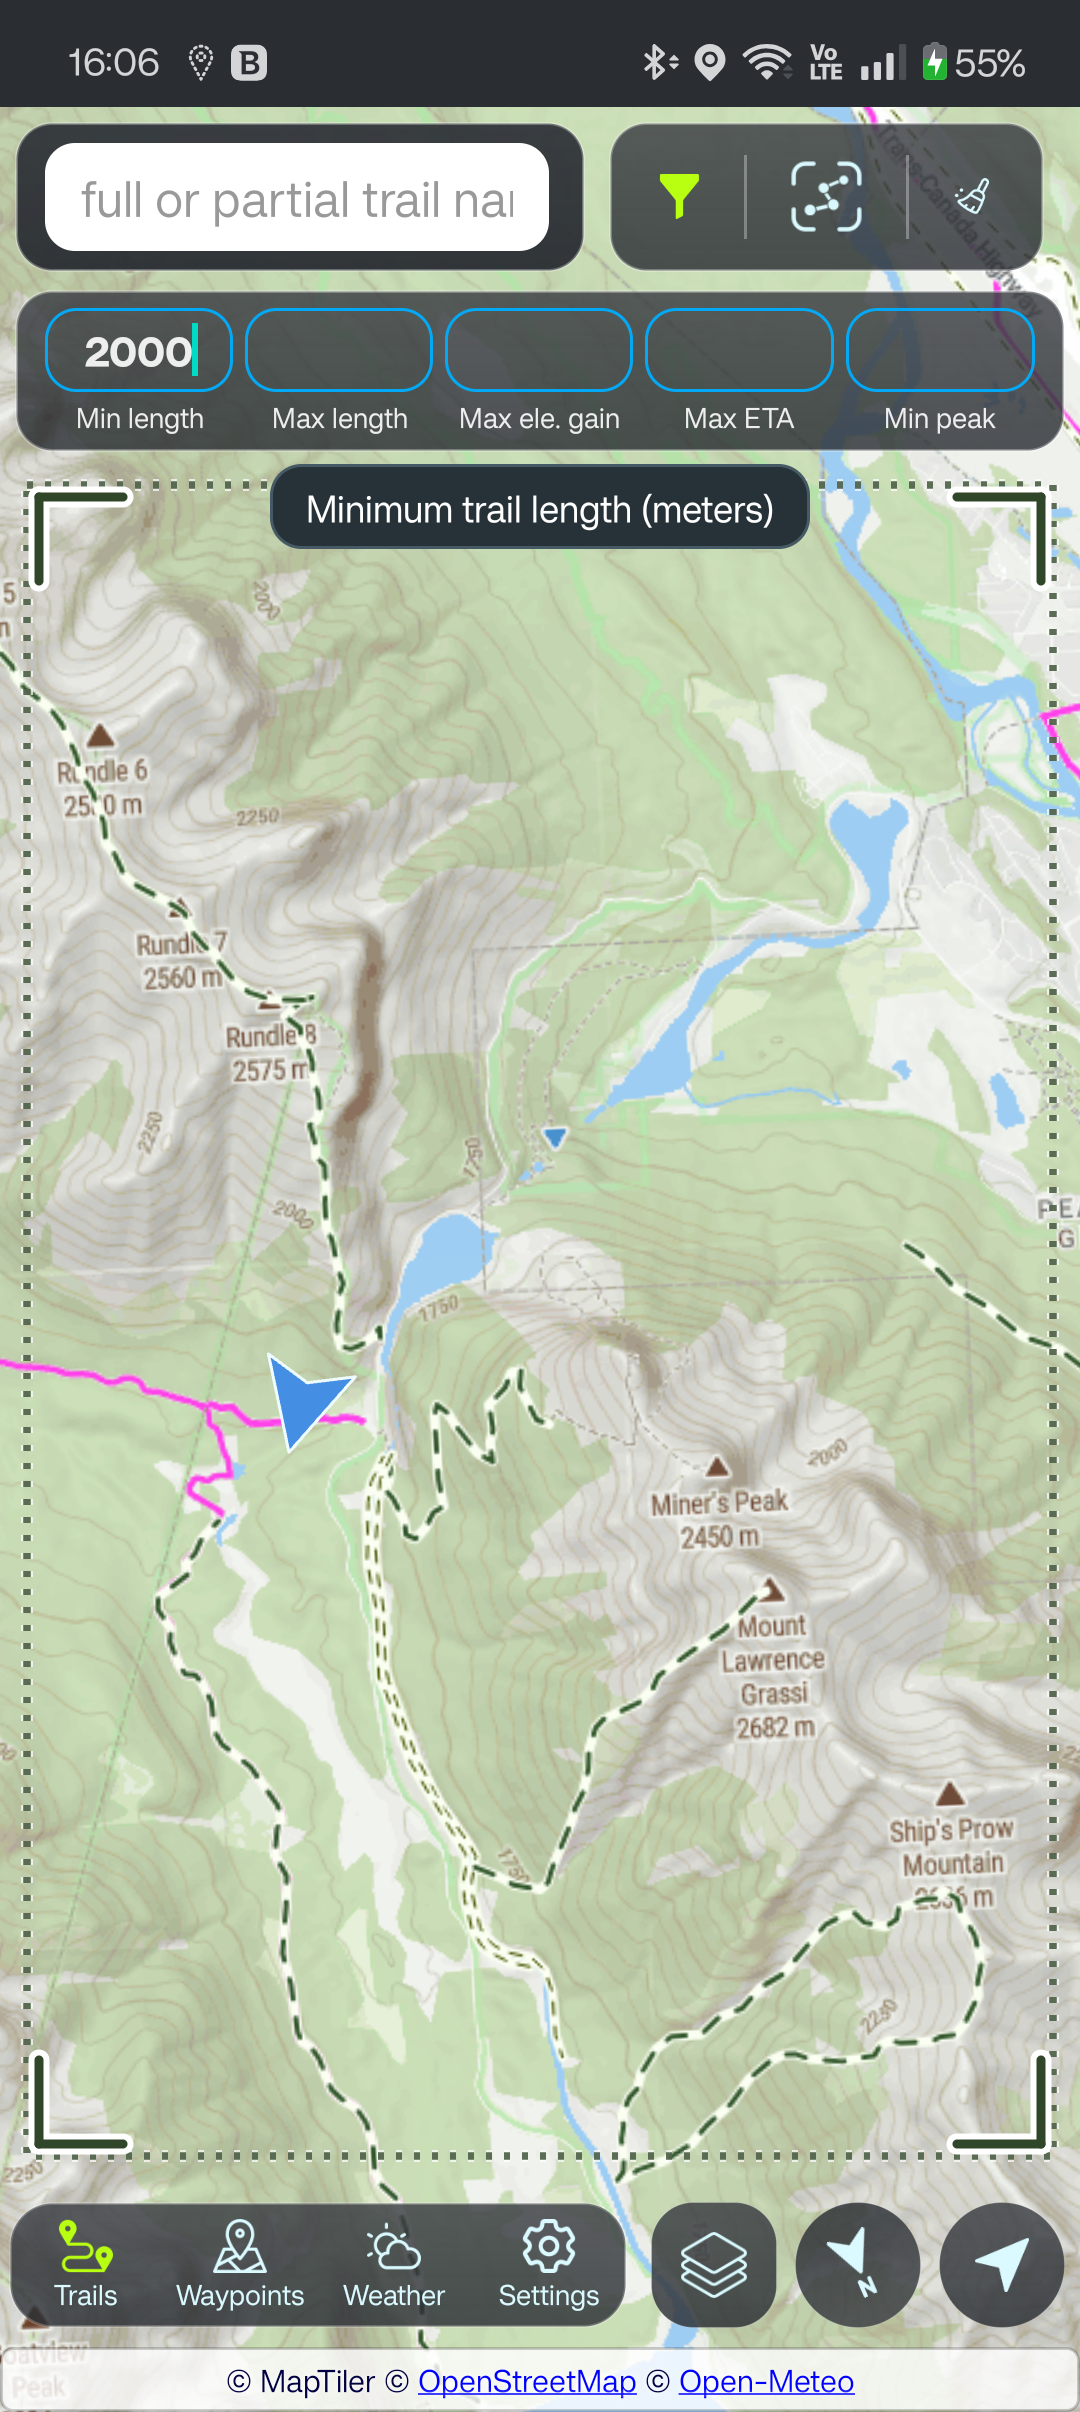
Trail Visibility Filter
Filter highlighted trails by length, elevation gain, estimated time, and peak altitude — instant client-side filtering
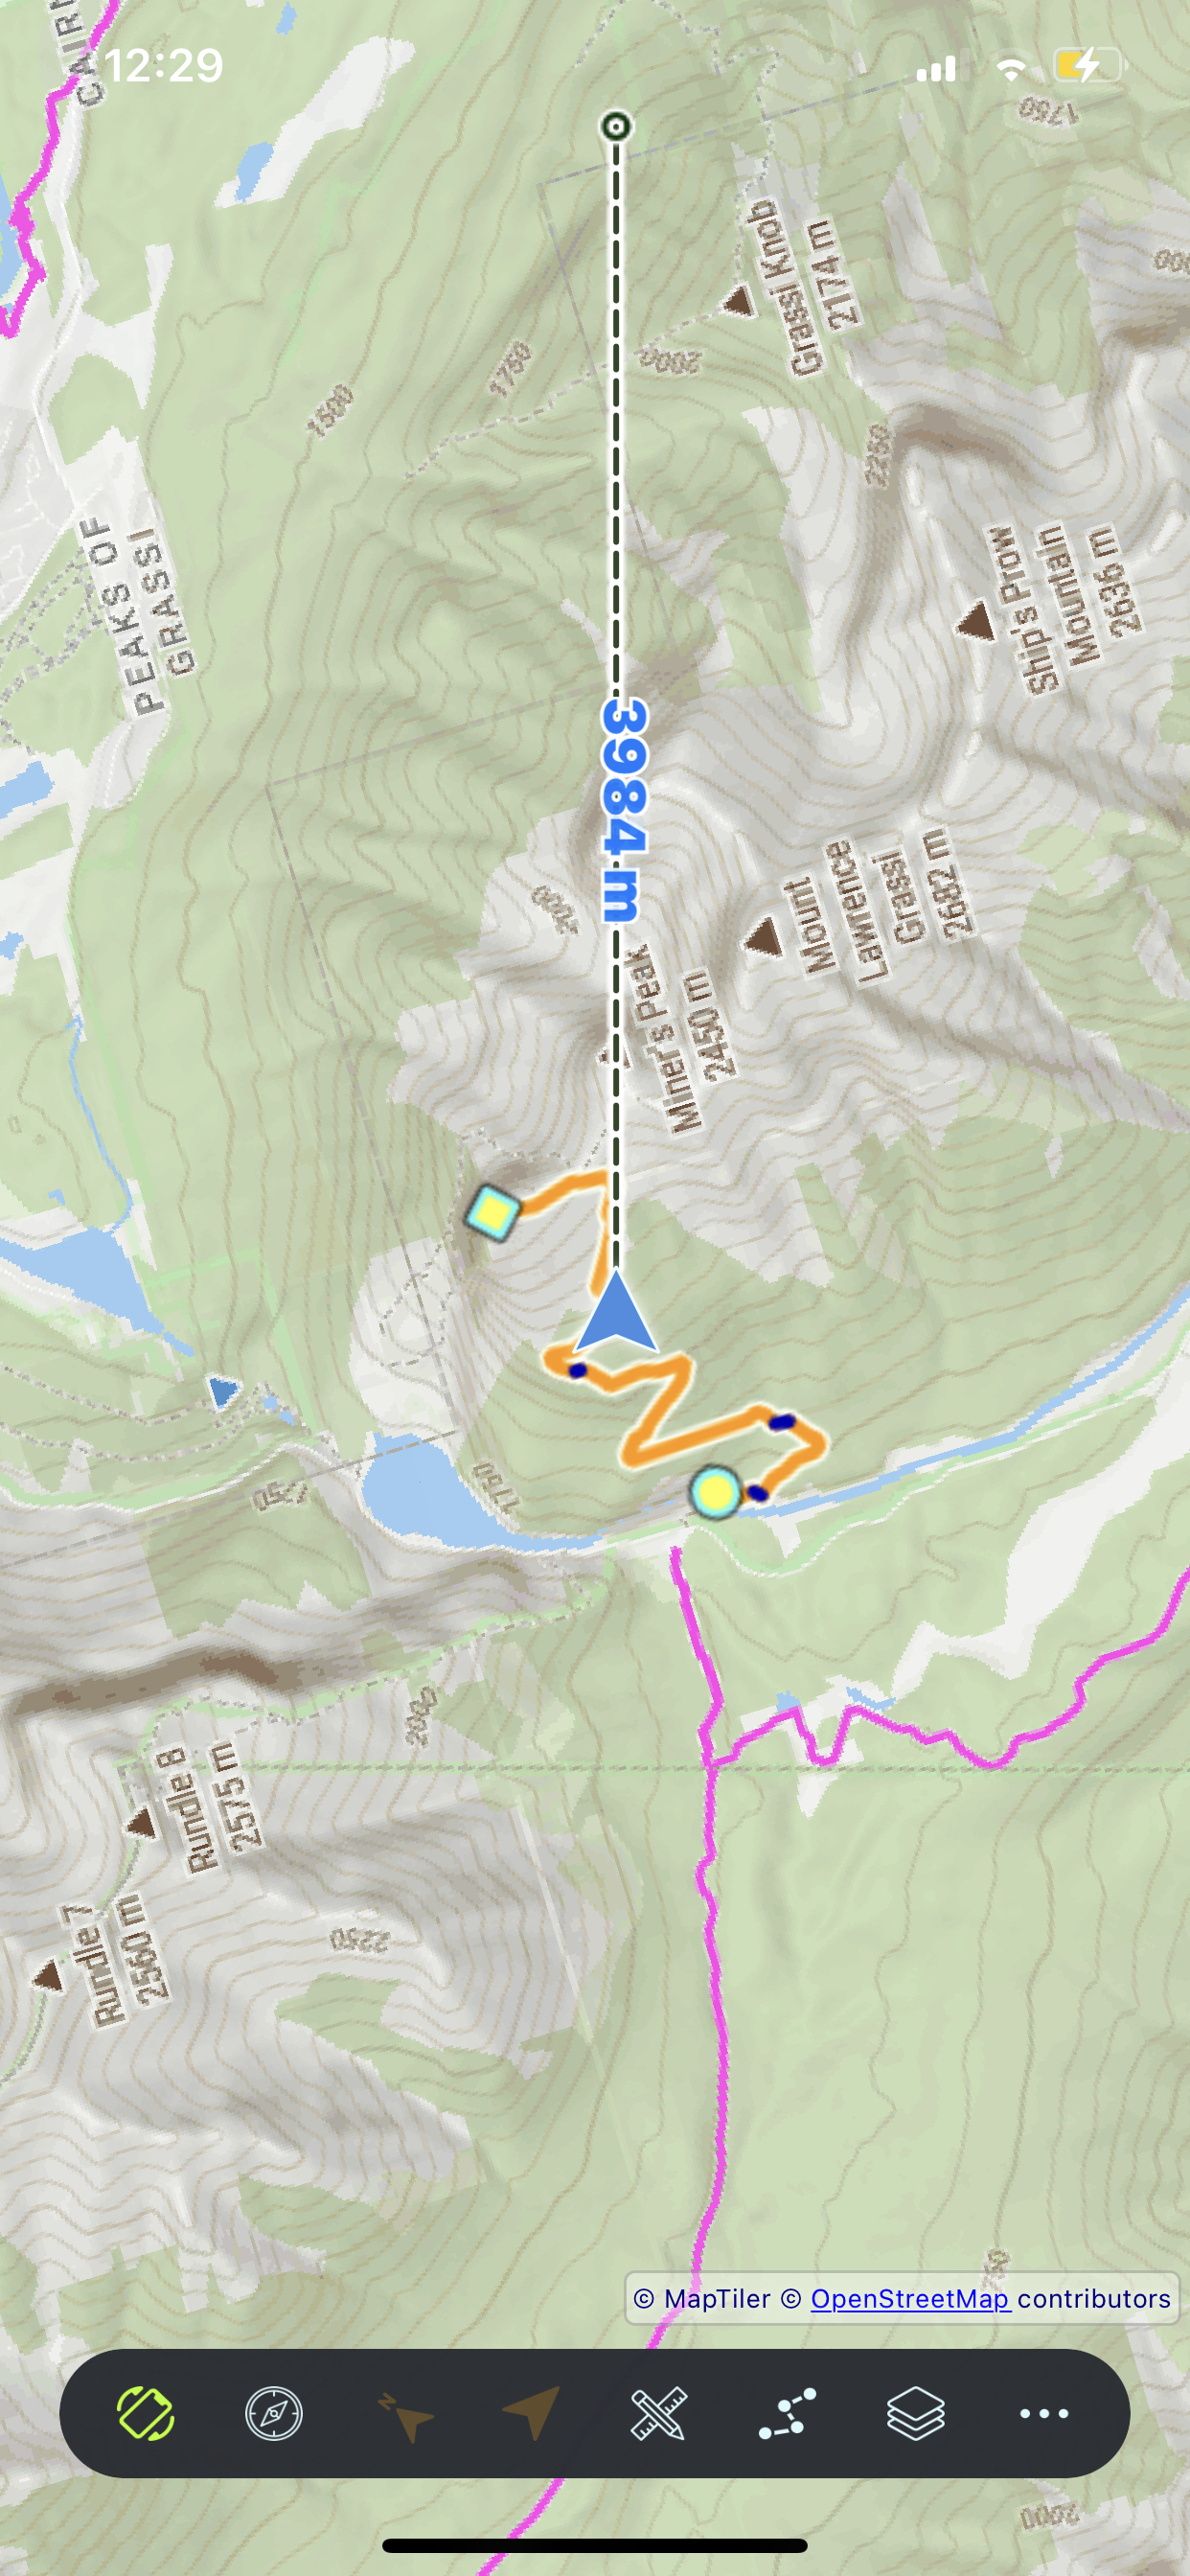
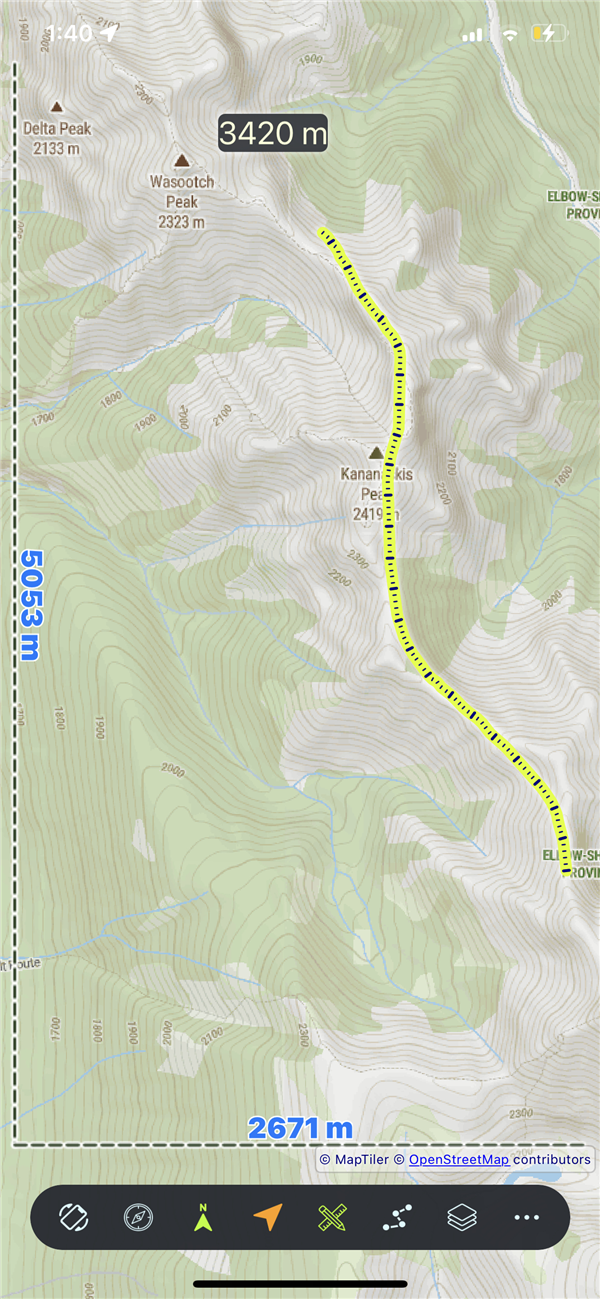
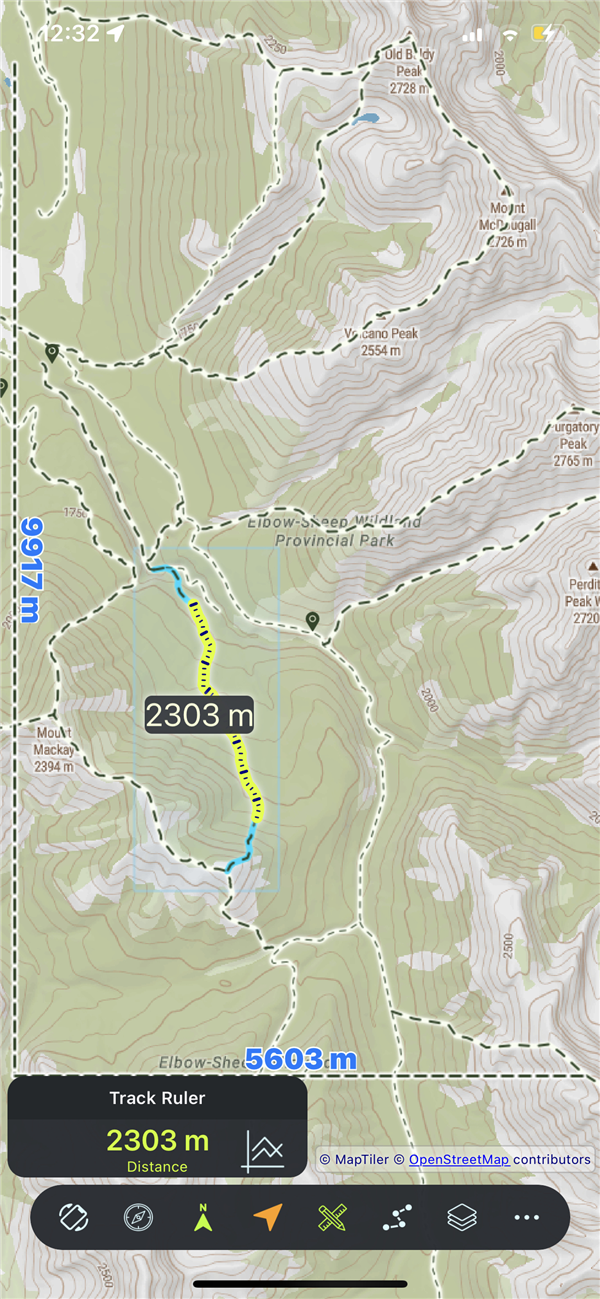
Measurement
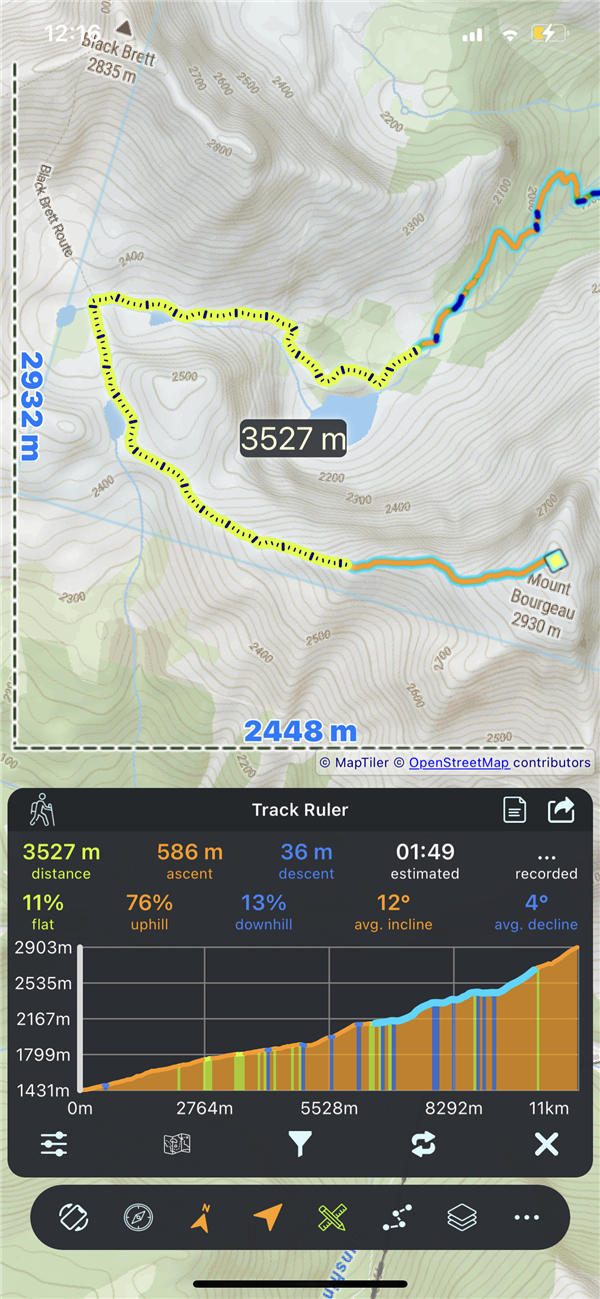
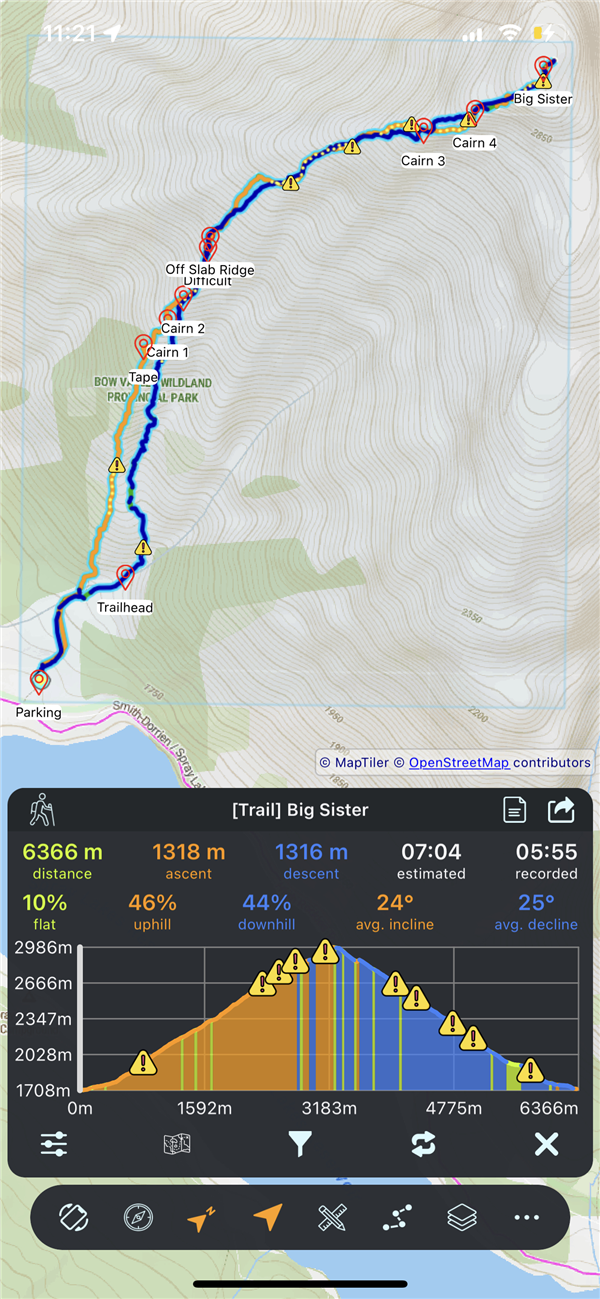
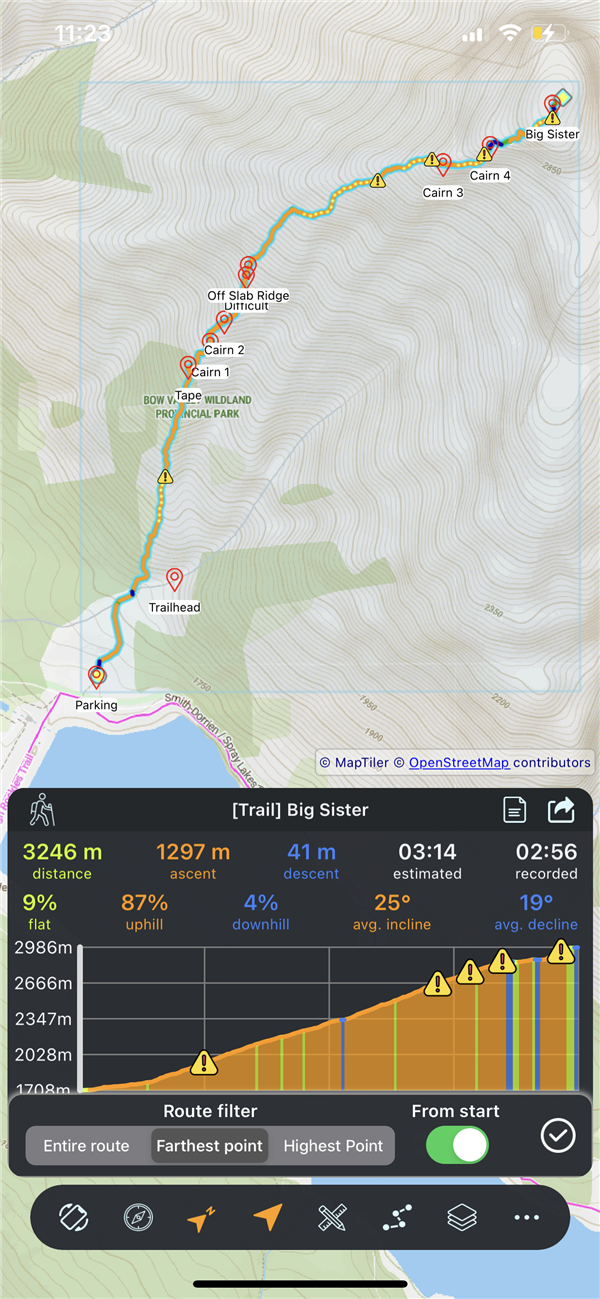
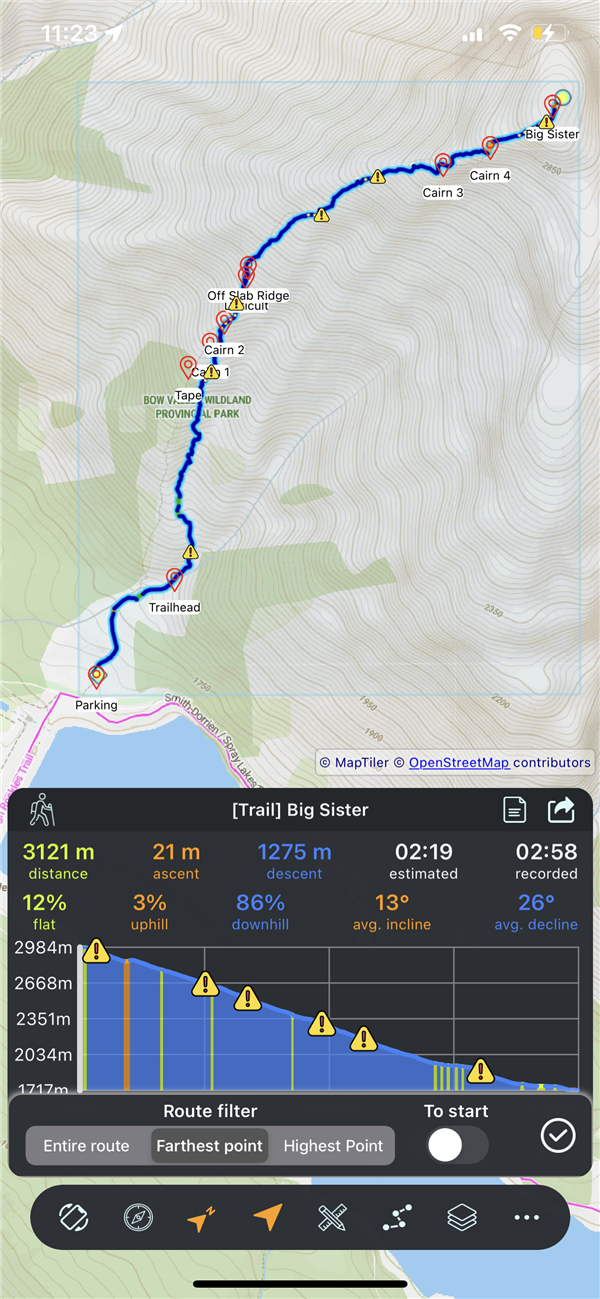
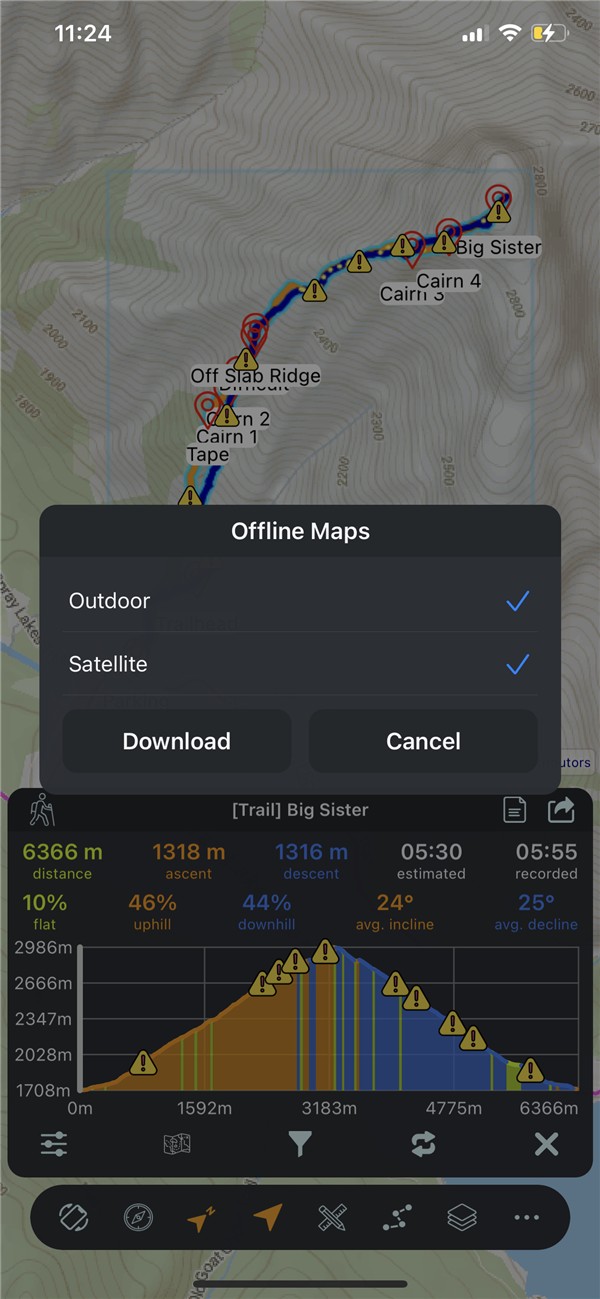
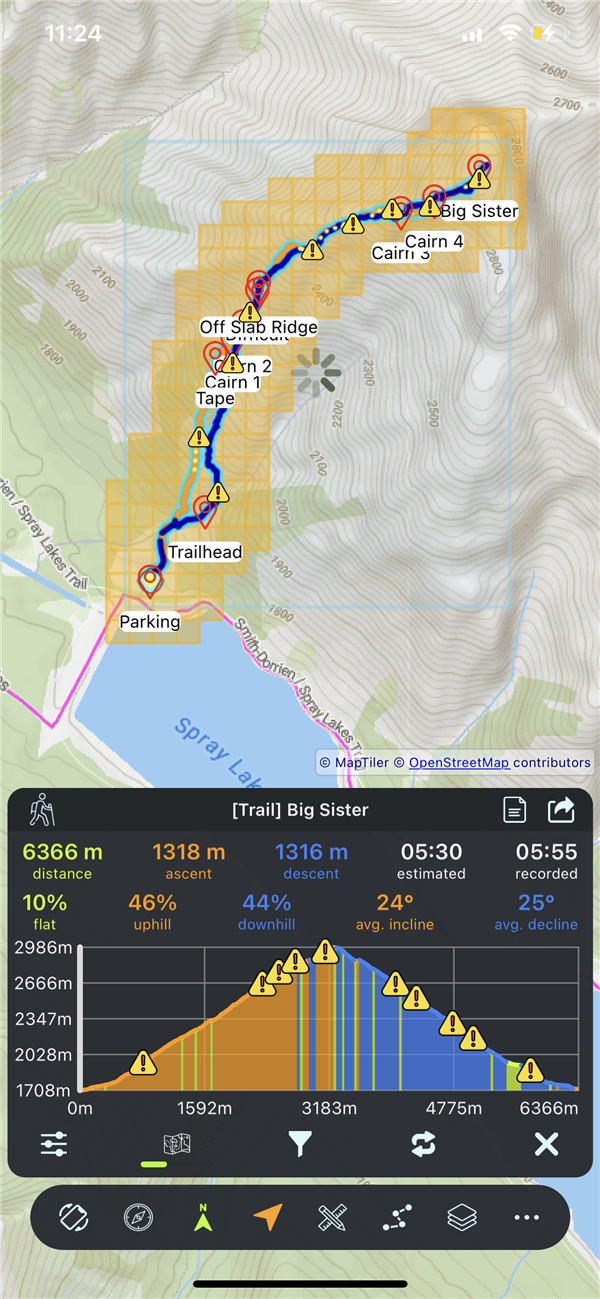
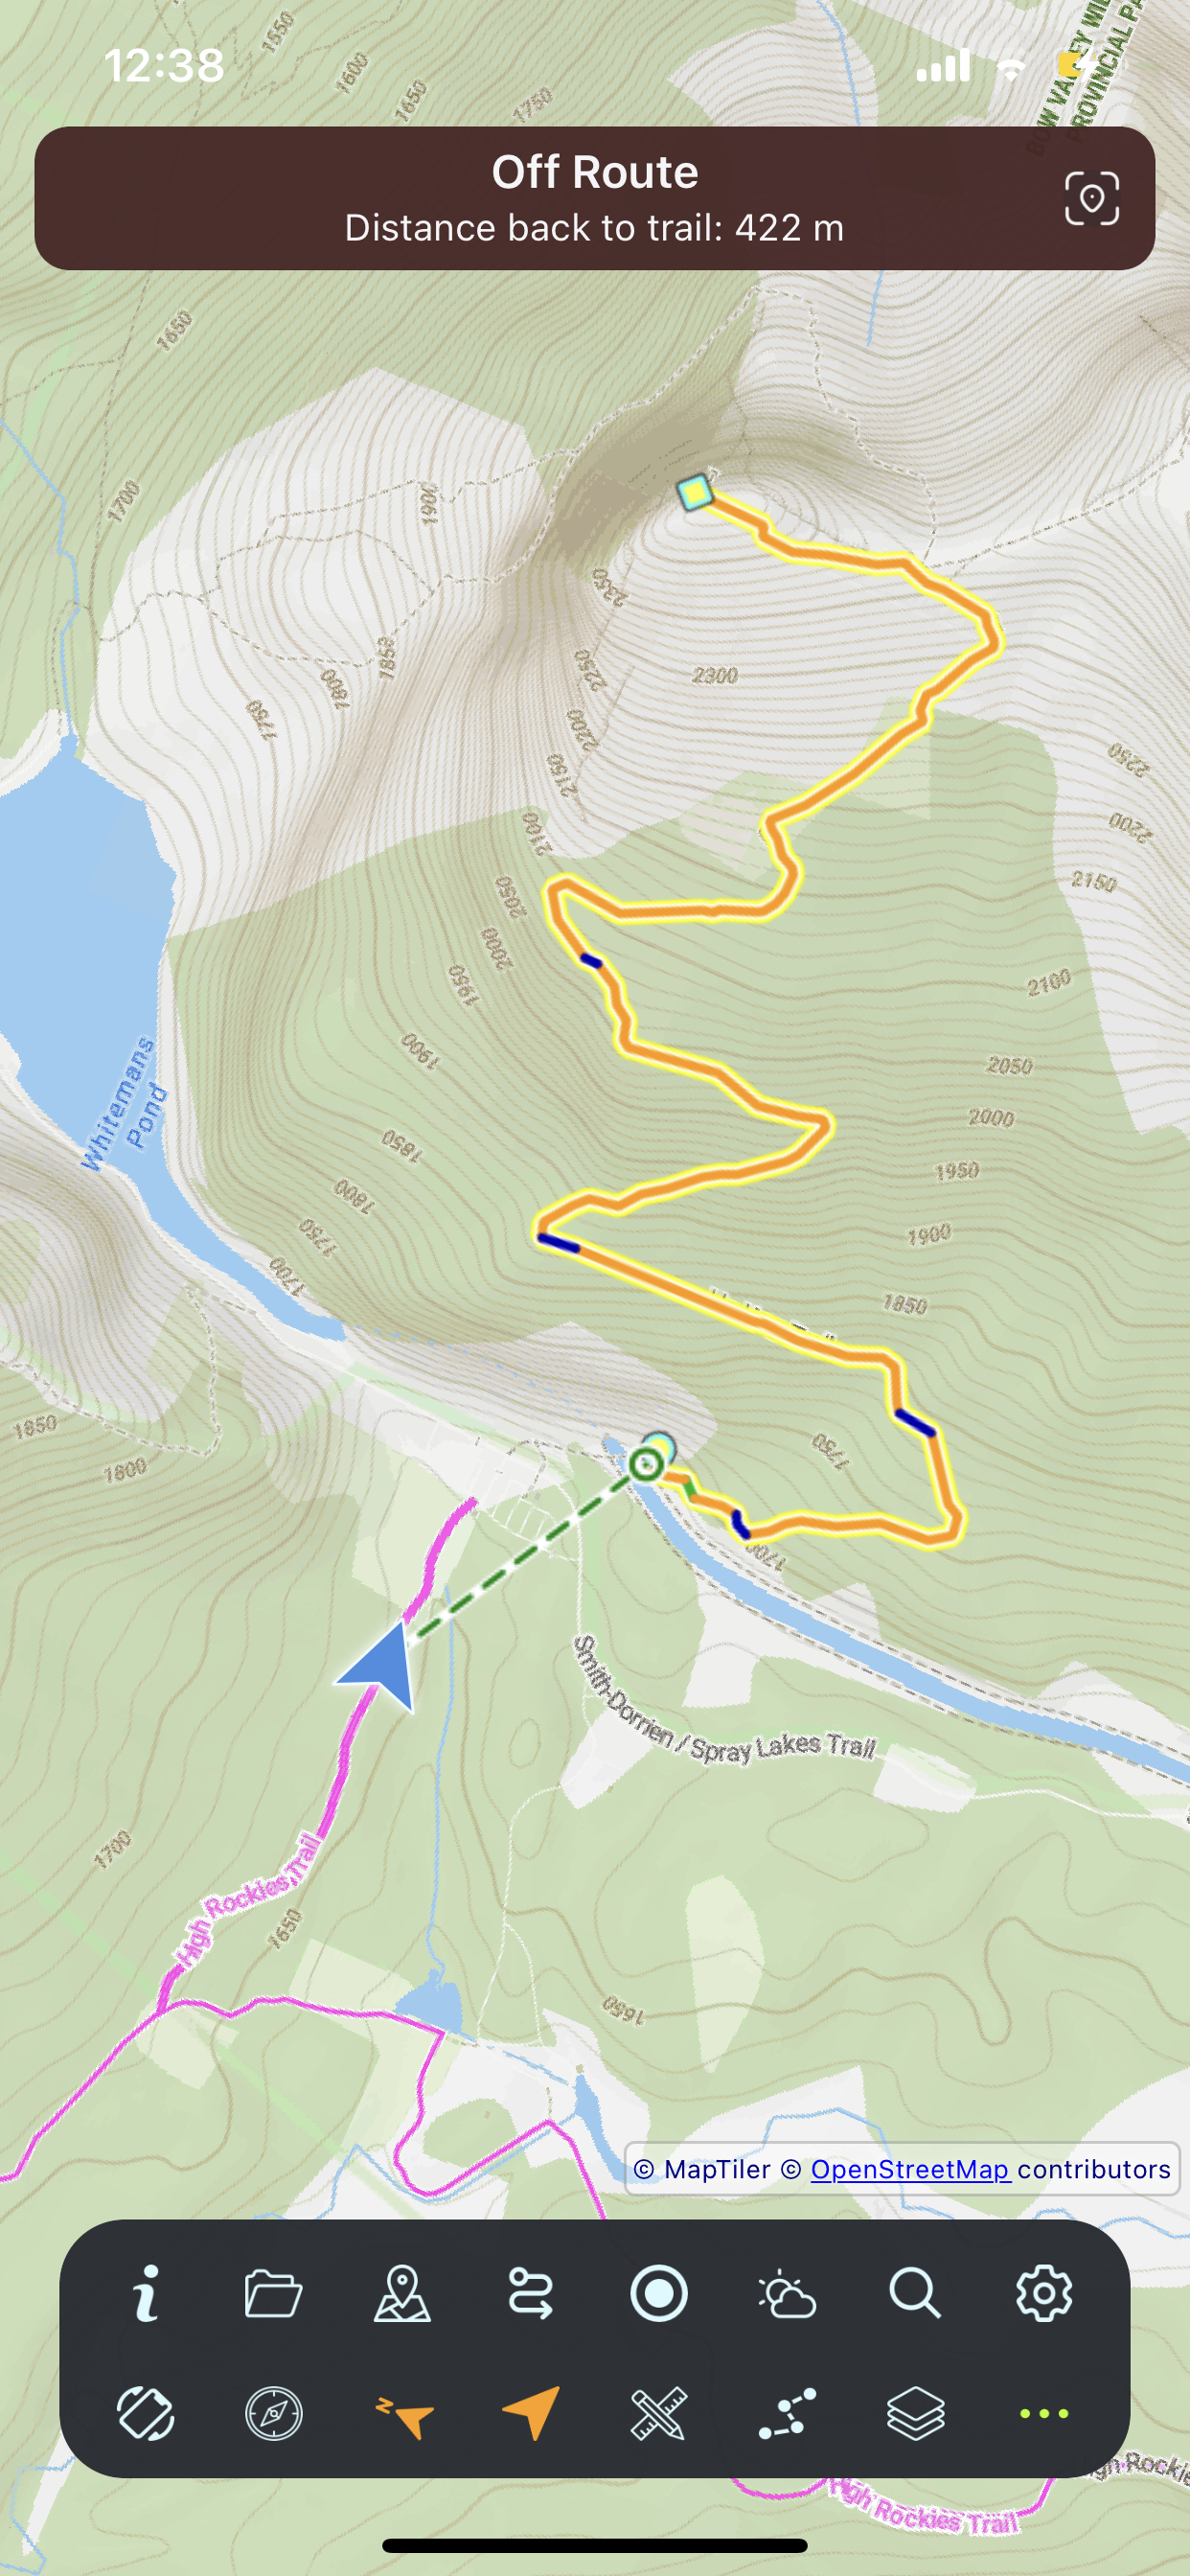
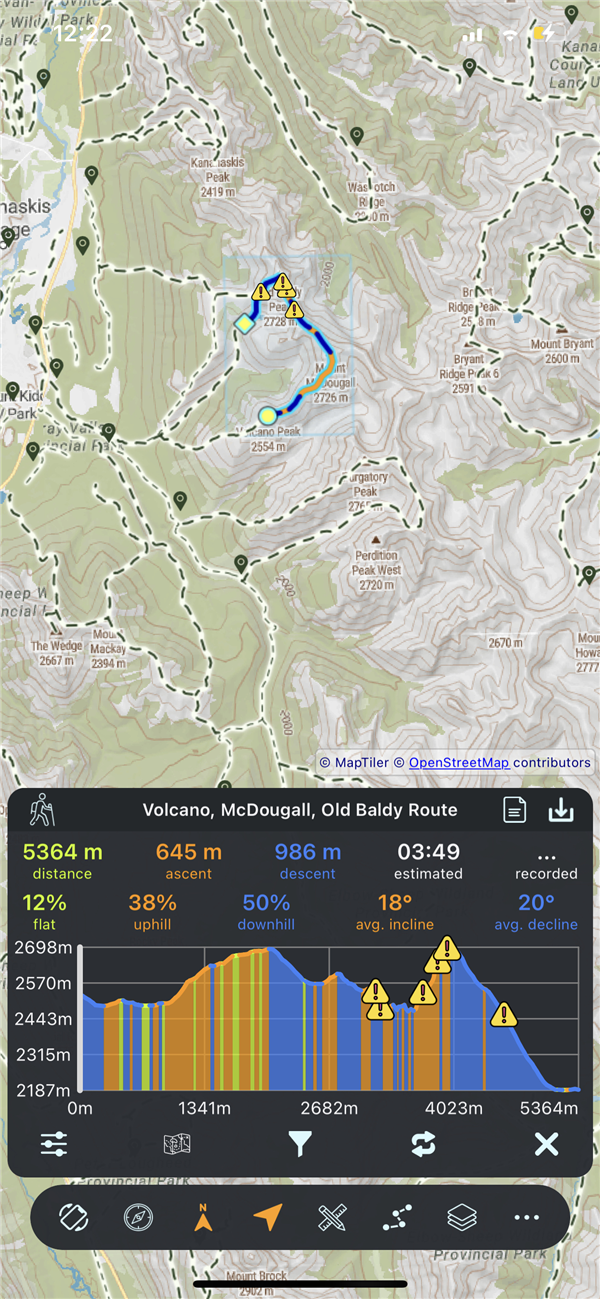
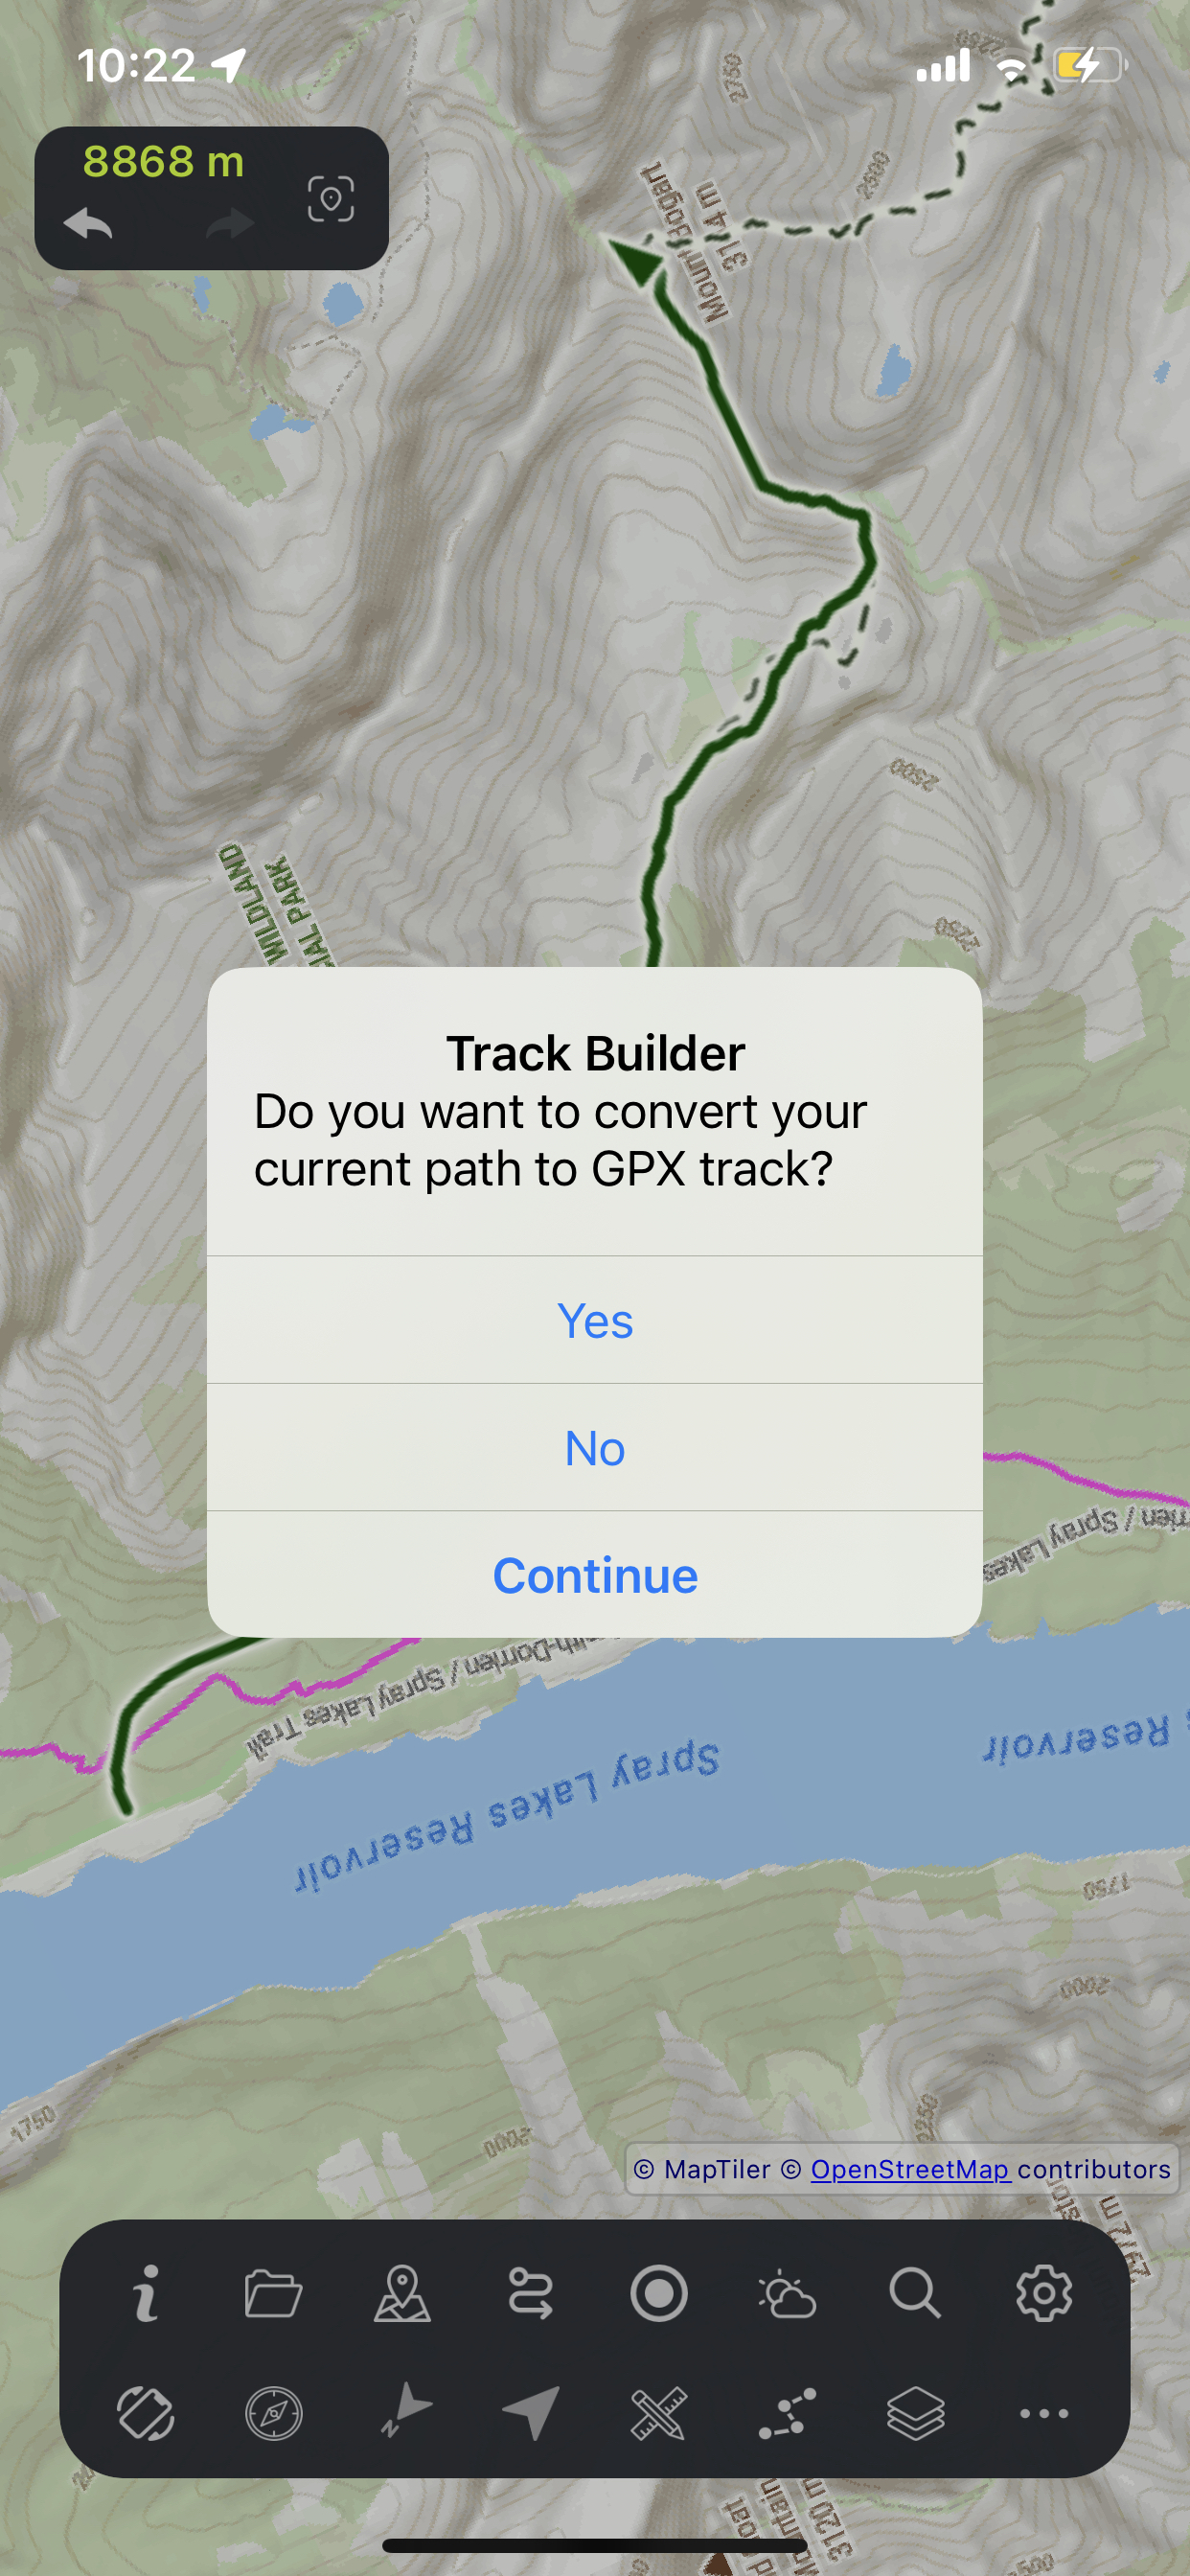
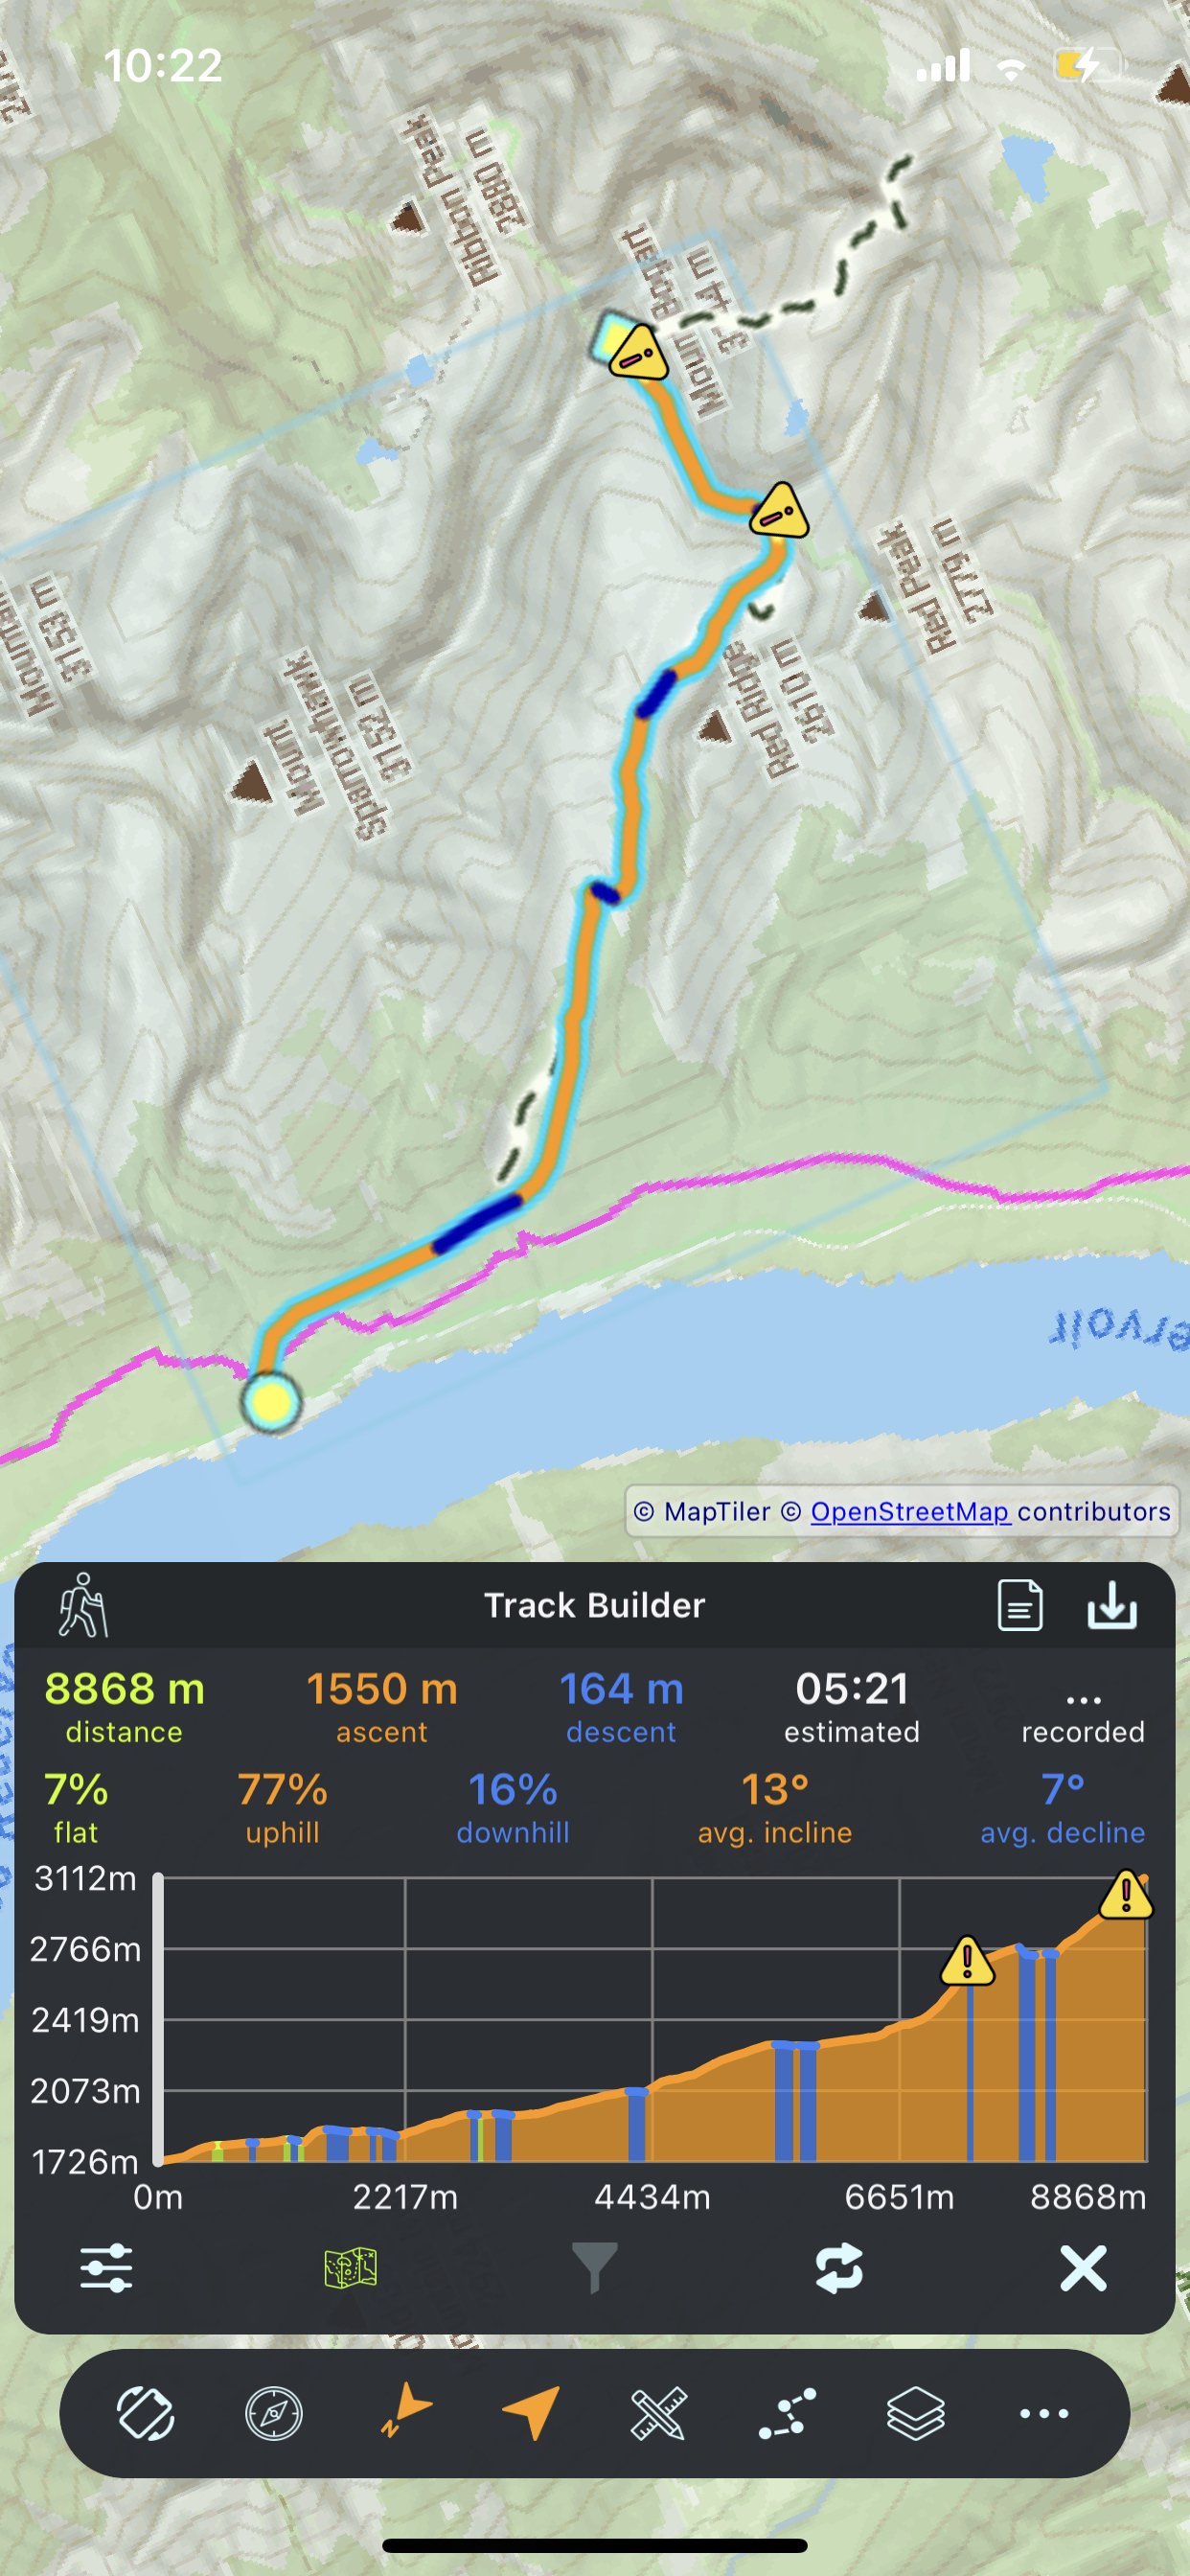
GPX Track Analysis
Load GPX files
Import any standard GPX file from your device
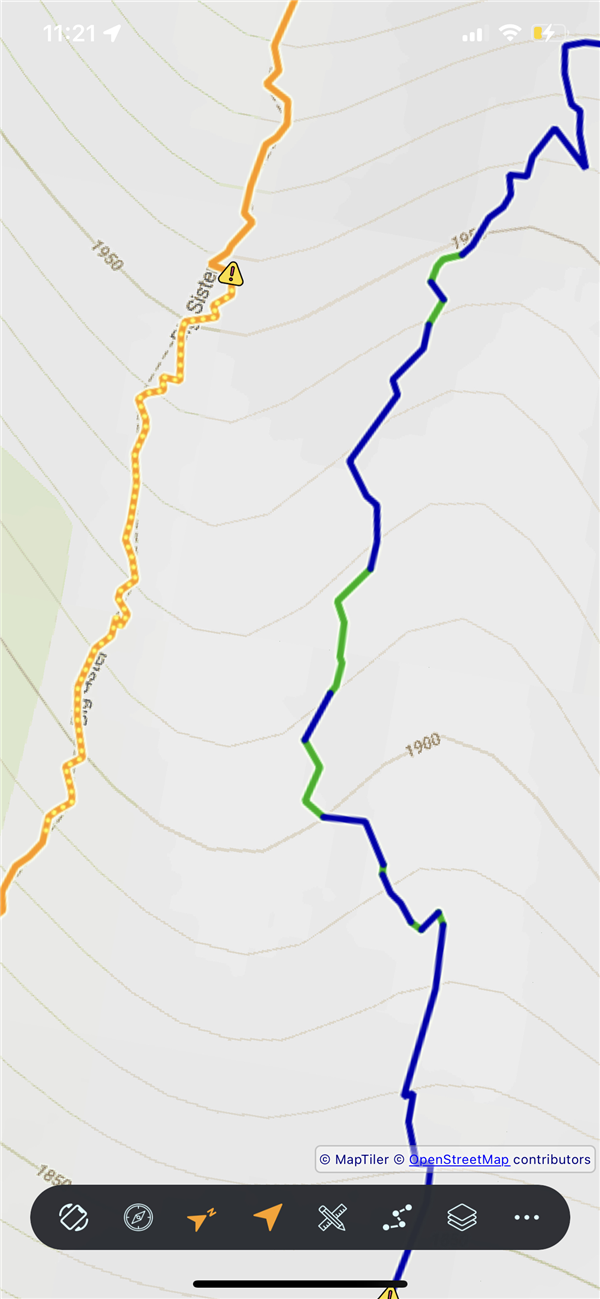
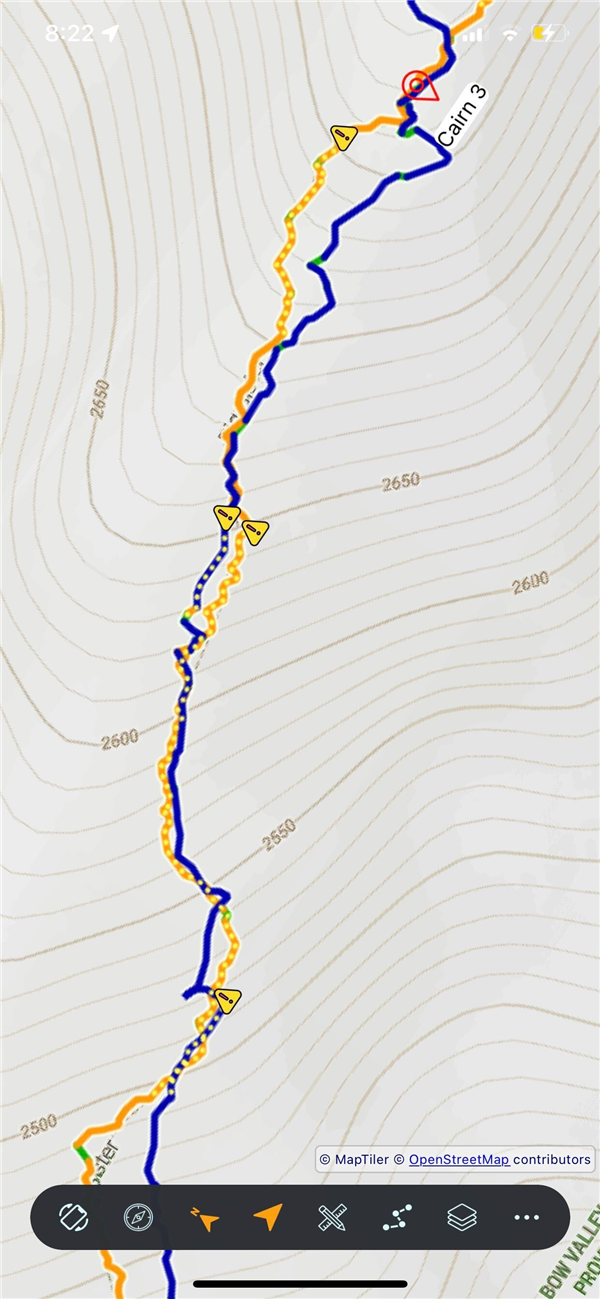
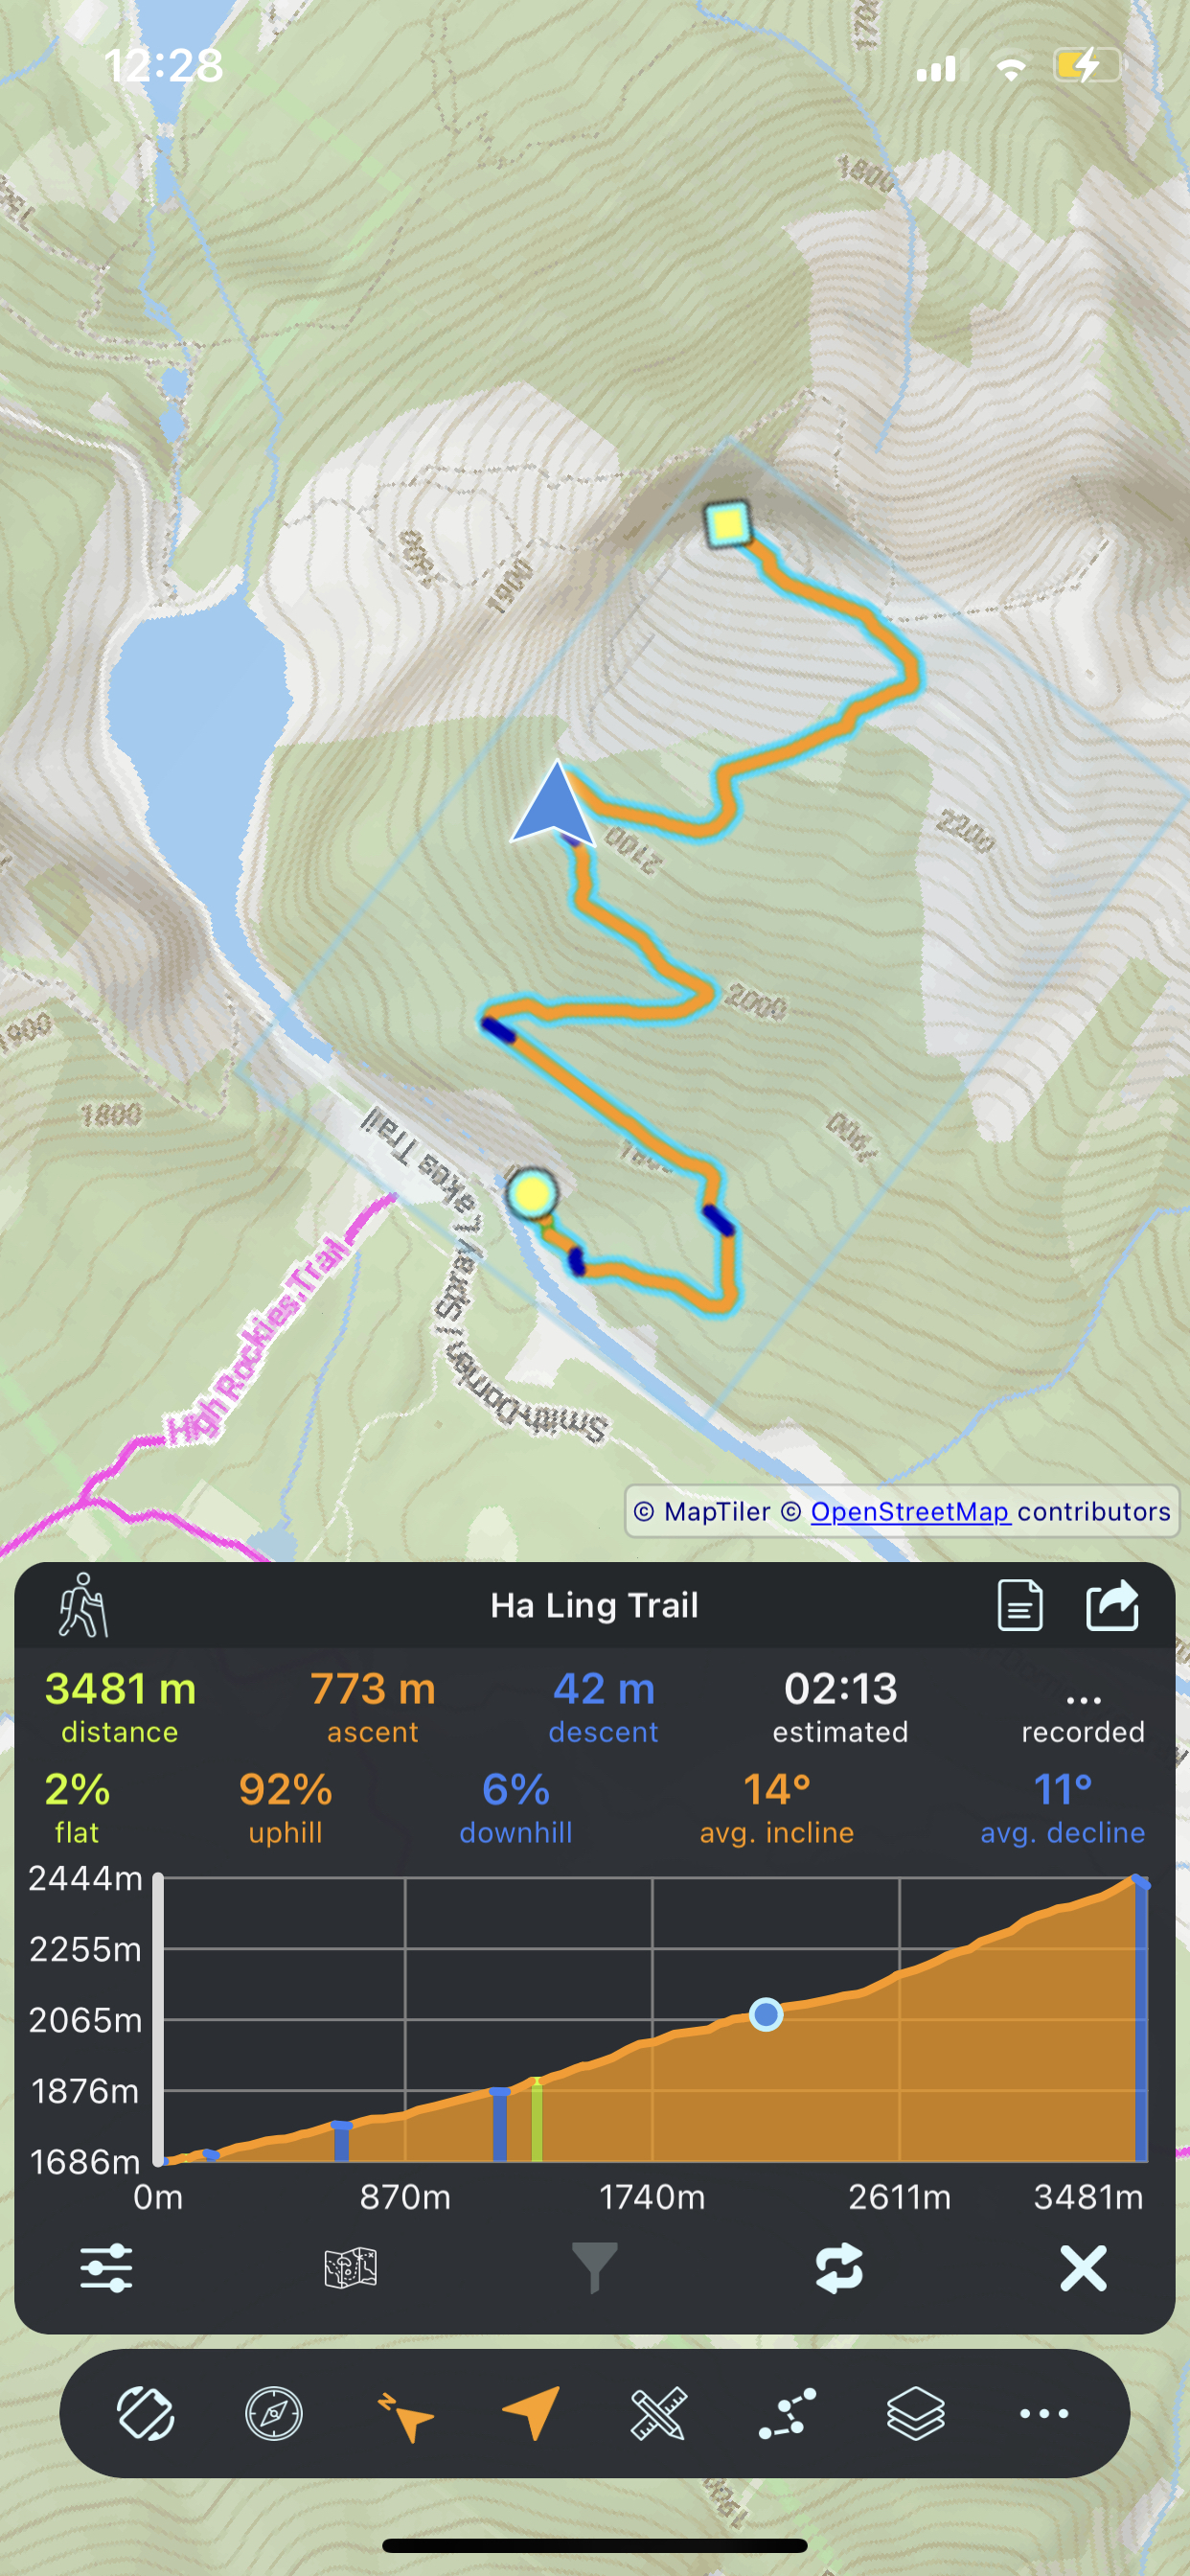
Elevation Coloring
Green=flat, orange=climb, blue=descent, yellow=steep
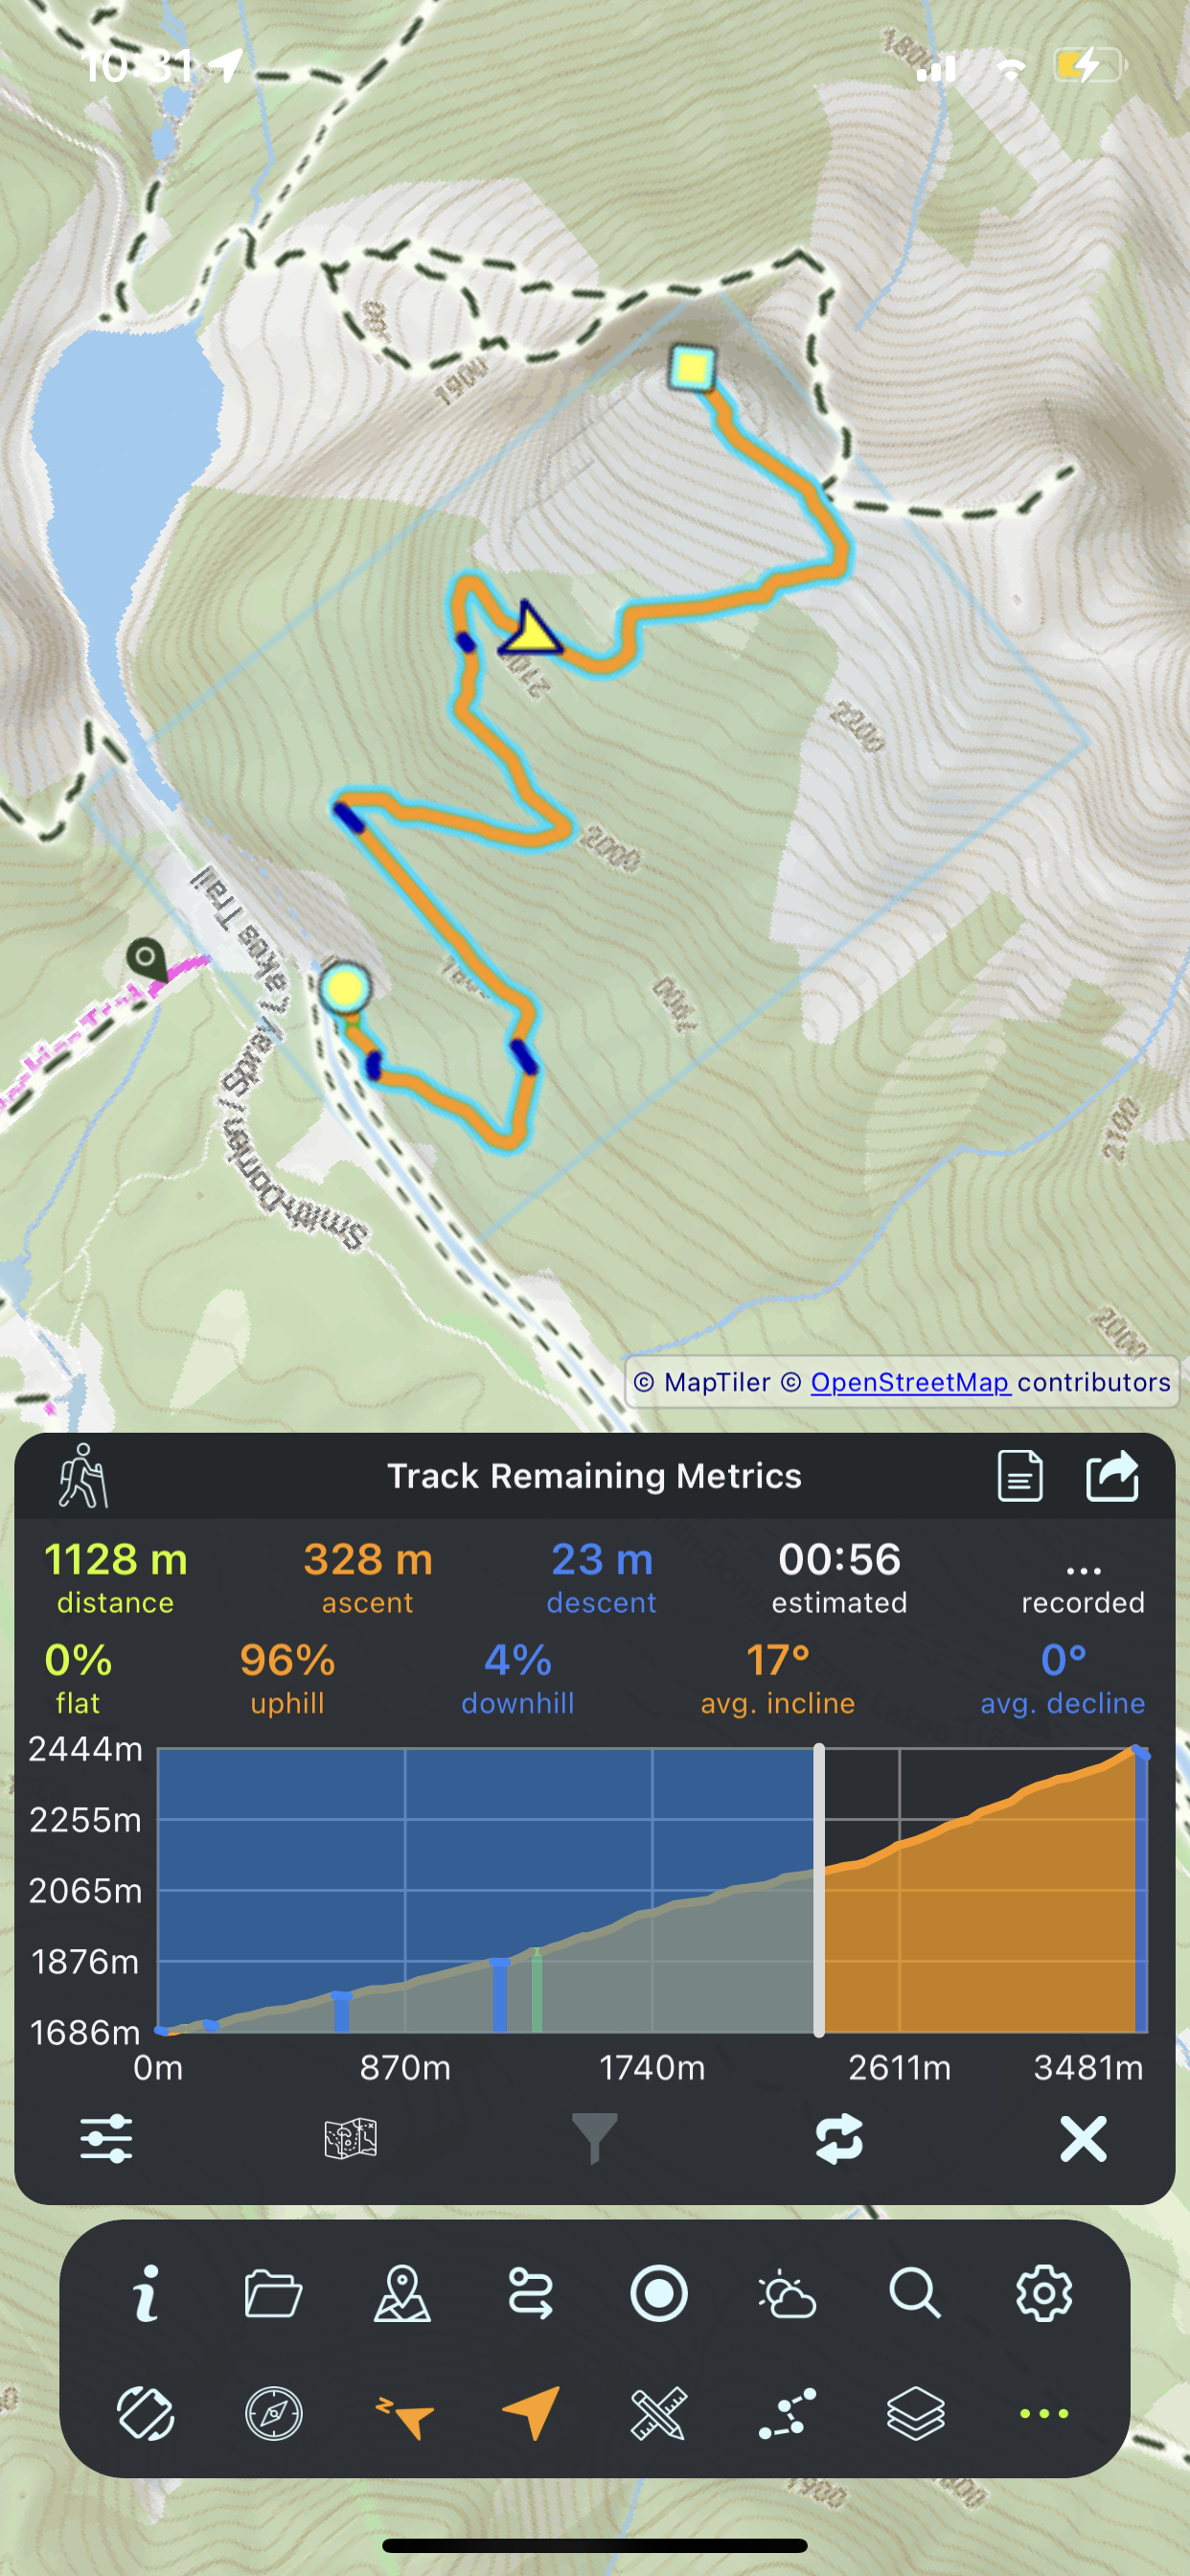
Elevation Chart
Interactive track profile — drag to scrub and center the map on that position
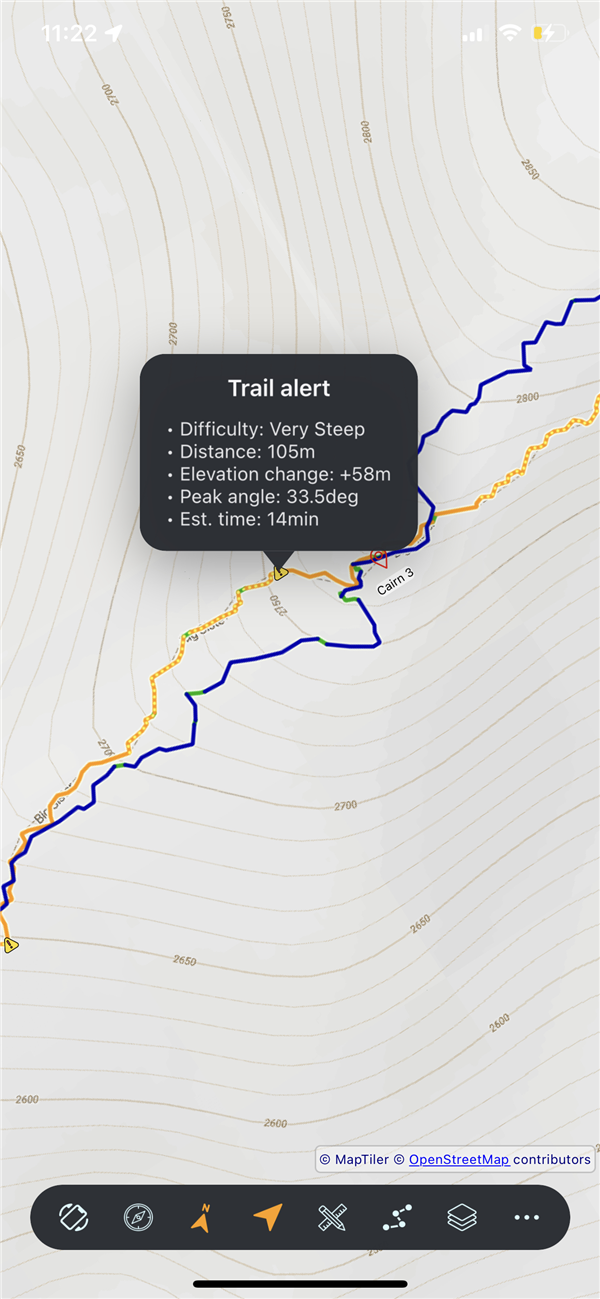
High-Grade Segments
Yellow dashed overlay on steep terrain
Alert Points
Tap warnings for detailed grade explanations
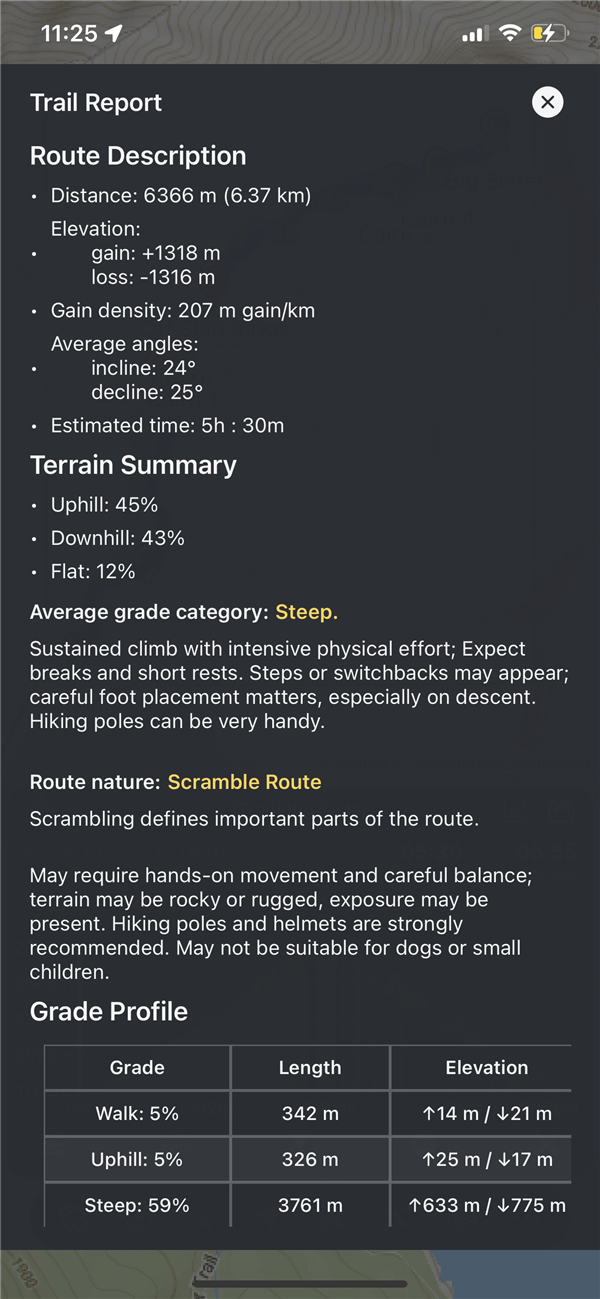
Trail Report
Comprehensive terrain analysis with tables
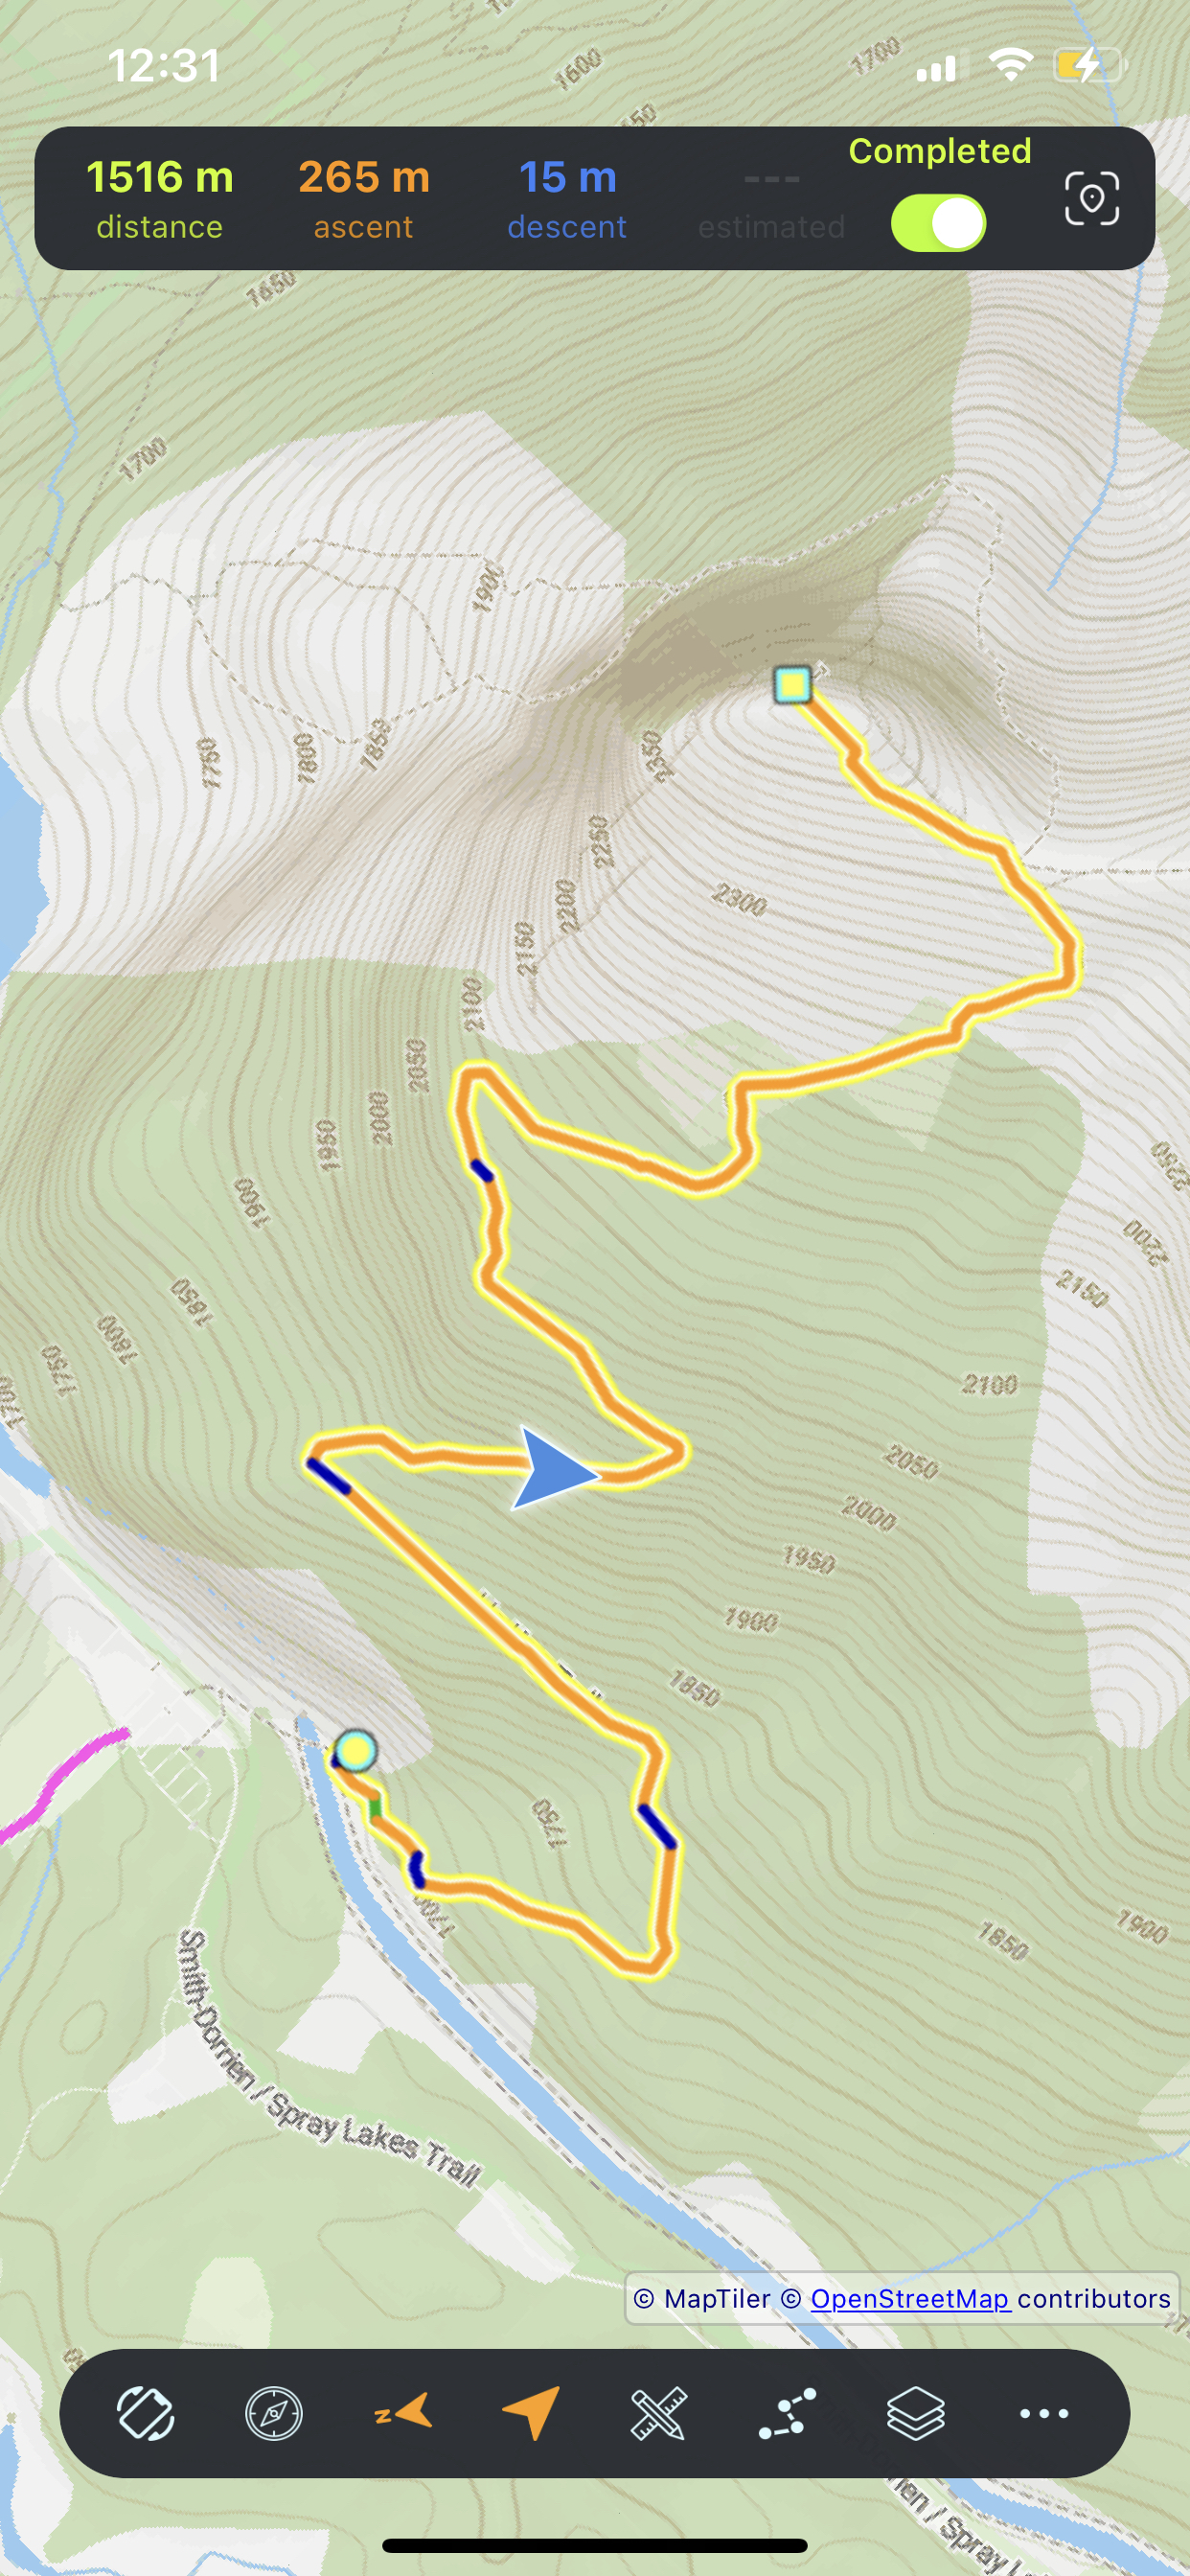
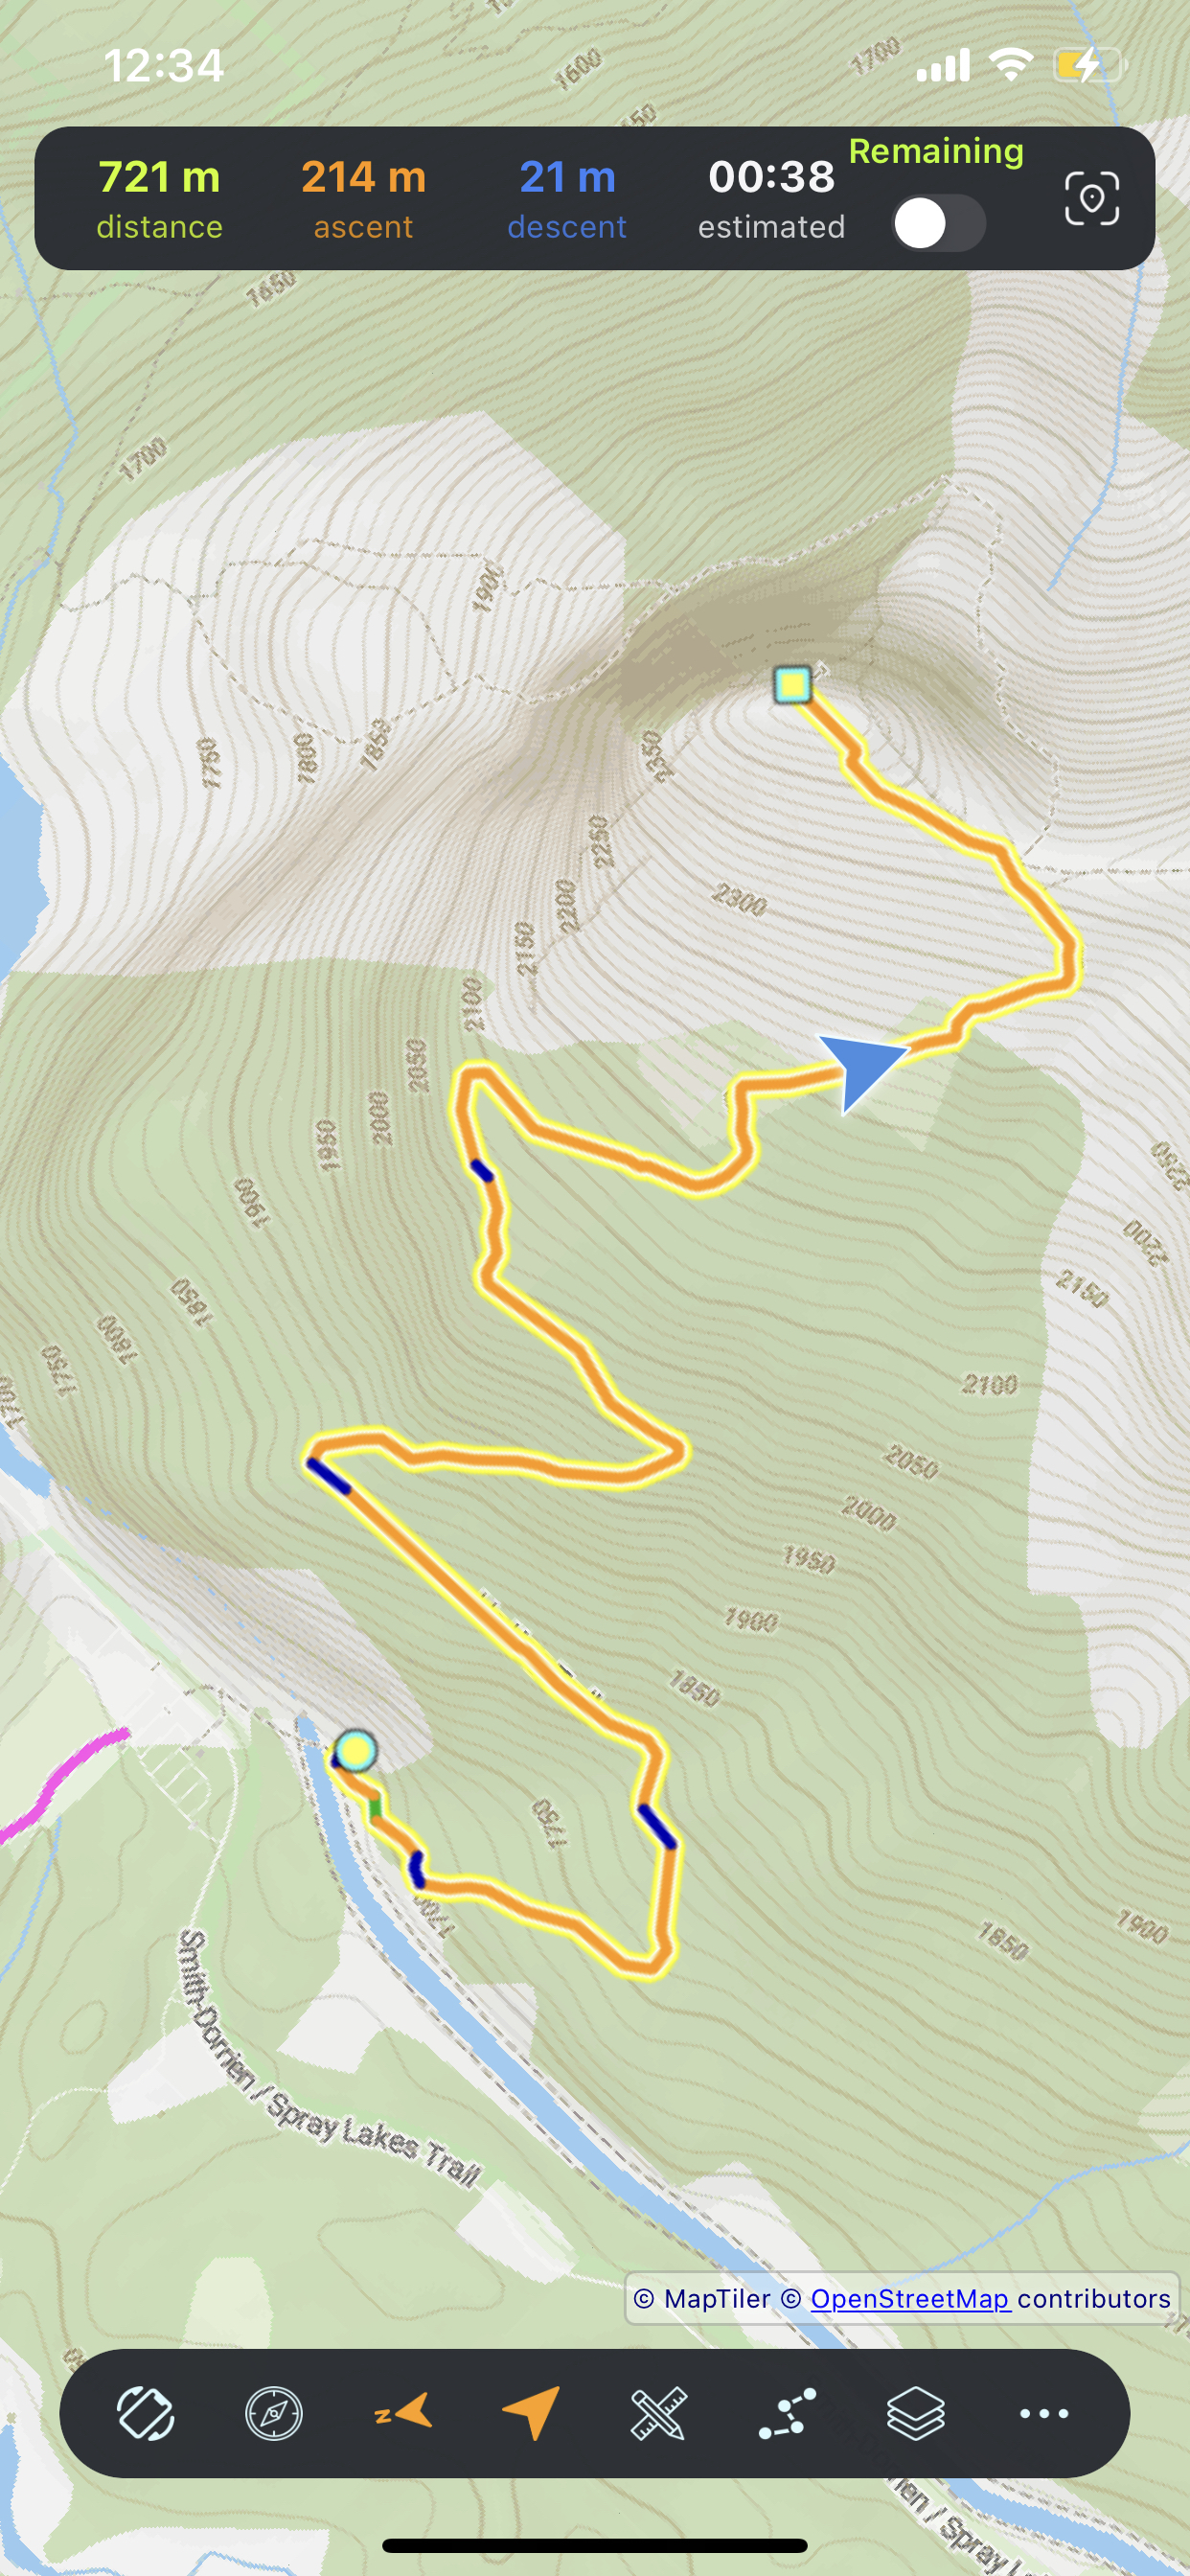
Statistics
Distance, gain, loss, time, min/max elevation
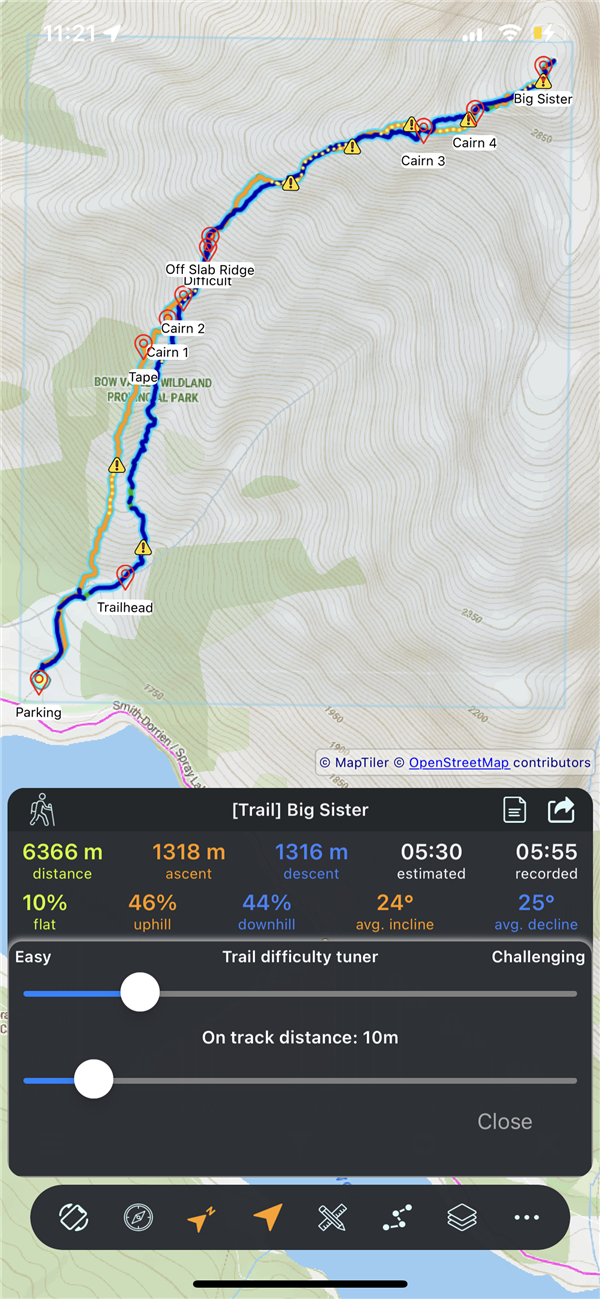
Track Settings
Terrain complexity, on-track distance threshold
Track Filter
To max altitude, to max distance, direction
Save & Share
Export, share, rename, reverse, delete tracks
Offline Maps
Download map tiles along your track
Height Map
Auto-downloads elevation for OSM/Builder tracks